
Our research team releases monthly housing trends reports These regular reports break down inventory metrics like the number of active listings and the pace of the market. In addition, we continue to give readers more timely weekly updates, an effort that began in response to the rapid changes in the economy and housing. Generally, you can look forward to a and the latest weekly housing data on Thursdays and weekly video from our economists. Here鈥檚 what the housing market looked like over the past week.
What this week’s data means:
Heading further into the new year, the housing market is showing signs of increased activity. A recent surge in new listings, up double digits in late January, is providing buyers with a larger pool of options, while growing inventory and a narrowing gap in time on market suggest improving buyer demand. Meanwhile, for 35 weeks, national median home listing prices have been flat or declining year-over-year. While this partially reflects a shift toward smaller, more affordable homes, the growth in the median list price per square foot has also cooled. These factors hint at a market with stabilizing conditions, offering opportunities for buyers to find more affordable options and encouraging sellers to act strategically in a more competitive landscape.
Key findings:
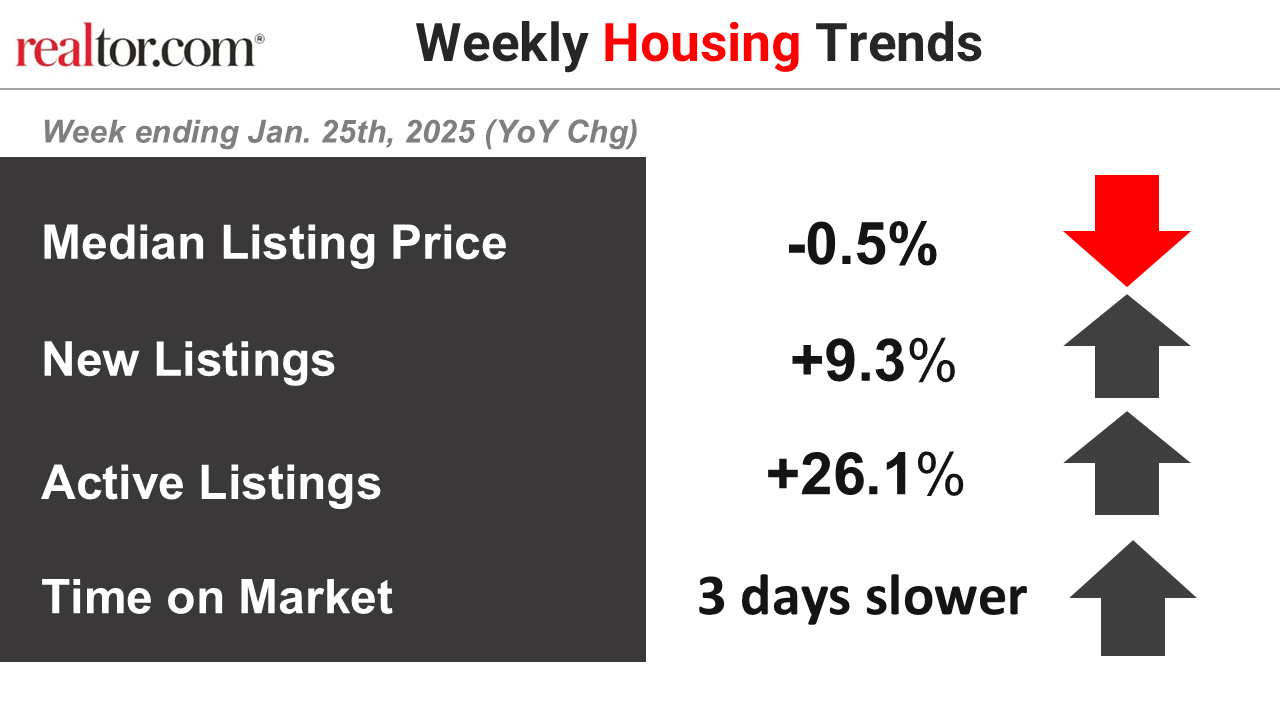
- The median listing price fell by -0.5% year-over-year.
This week was the 35th in a row in which the national median home listing price was flat or falling from the corresponding week last year, a stretch that dates back to the beginning of June 2024. However, when a change in the mix of inventory toward smaller homes is accounted for, the median listing price per square foot increased by 1.3% this week compared with the same time last year. While still positive, the median listing price per square foot growth rate has been softening since May. For potential homebuyers, this means more affordable (albeit smaller) homes are available on the market this year and softening price growth means that when mortgage rates do decline below current levels, homes become more affordable relative to last year.听
- New listings鈥揳 measure of sellers putting homes up for sale鈥搃ncreased 9.3%.
The final three weeks of January marked a turnaround in listing activity, with newly listed homes increasing double-digits over last year in the latter part of this month. While the bump in January listings could be caused by sellers who jumped to prepare to list after fall鈥檚 lower mortgage rates, it could also be due to an easing of the lock-in effect or buyers needing to finally adapt to life changes. Nonetheless, it offers buyers a fresh pool of homes to consider, and in some cases, at lower prices than the previous year.
- Active inventory increased, with for-sale homes 26.1% above year-ago levels.听
For the 64th consecutive week, the number of homes for sale has increased compared to the same time last year. This week also marked the third straight week where the growth rate has increased, fueled by the entrance of many new listings on the market.
- Homes spent 3 days more on the market compared to this time last year.
For 40 consecutive weeks, homes have spent more time on the market than the previous year. However, this gap has been more or less decreasing since November. The gap in time on market shrinking despite growing inventory is a good sign, potentially signaling a stabilizing of buyer demand.
Data summary:
| All changes year over year | Year-to-date 2025 | Week ending Jan 11, 2025 | Week ending Jan 18, 2025 | Week ending Jan 25, 2025 |
| Median listing prices | -1.6%听 | -2.2% | -2.2% | -0.5% |
| New listings听 | +11.9%听 | +8.6% | +17.9% | +9.3% |
| Active listings听 | +24.8%听 | +23.2% | +25.1% | +26.1% |
| Time on market | 4 days slower | 6 days slower | 4 days slower | 3 days slower |