Our research team releases monthly housing trends reports. These regular reports break down inventory metrics like the number of active listings and the pace of the market. In addition, we continue to give readers more timely weekly updates, an effort that began in response to the rapid changes in the economy and housing. Generally, you can look forward to a听Weekly Housing Trends View and the latest weekly housing data on Thursdays and weekly video from our economists. Here鈥檚 what the housing market looked like over the past week.
What this week’s data means
This week, the market continued to move in the same direction it has been throughout the new year. Prices are falling, new listings and active inventory are increasing, and homes are spending more time on the for-sale market than they were in early 2024. This is all good news for buyers, who had been feeling the effects of the post-pandemic pinch in for-sale listings for several years until the market entered its current rebalancing phase. Though prices and mortgage rates are still significantly higher than they were five years ago, the cooling of the market means that buyers can take their time to find the right home for their needs, possibly even one with a reduced price.
Key findings
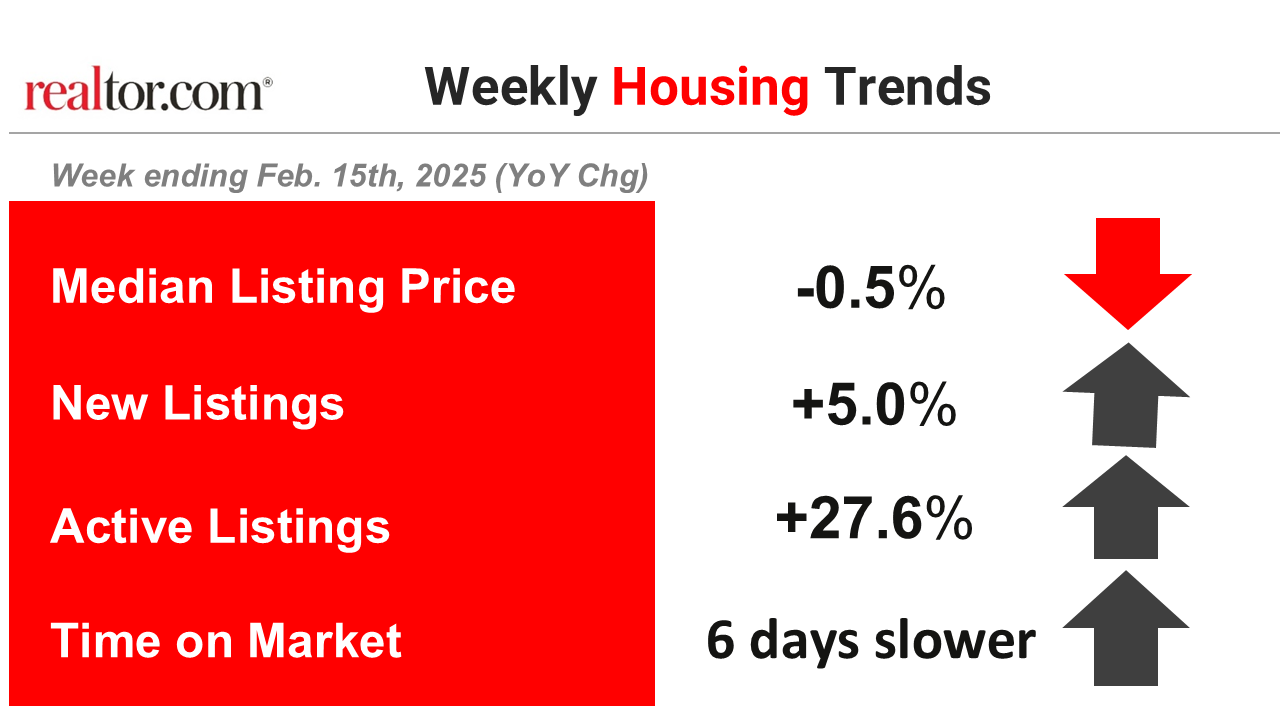
- The median list price fell by 0.5% year over year
This week was the 38th in a row in which the national median home list price was flat or falling from the corresponding week last year, a stretch that dates to the beginning of June 2024. This is tied with the last week of January for the smallest decrease in median home prices so far in 2025, due in part to a pullback in price reductions week over week.
- New listings鈥攁 measure of sellers putting homes up for sale鈥攊ncreased 5%
Newly listed inventory increased year over year for the sixth week in a row, as sellers go online for the spring buying season. Despite mortgage rates remaining stubbornly high and many prospective sellers feeling the lock-in effect due to their lower previous rates, new homes are hitting the market at a faster pace than in 2024 at this time.
- Active inventory increased, with for-sale homes 27.6% above year-ago levels
For the 67th consecutive week, the number of homes for sale has increased compared with the same time last year. This week also marked the sixth straight week where the growth rate has increased, fueled by the entrance of many new listings on the market. Buyers can expect more options to choose from in 2025 as we enter the start of the homebuying season.
- Homes spent 6 days more on the market compared with this time last year
For 43 consecutive weeks, homes have spent more time on the market than the previous year. This pickup is in part due to a dip in time on the market at this time in 2024, but also due to the slower pace of sales and increased level of active inventory.
Data summary
| All changes year over year | Year-to-date 2025 | Week ending Feb 1, 2025 | Week ending Feb 8, 2025 | Week ending Feb 15, 2025 |
| Median listing prices | -1.4% | -1.0% | -1.2% | -0.5% |
| New listings听 | +8.1% | +4.2% | +11.3% | +5.0% |
| Active listings听 | +25.5% | +26.7% | +27.5% | +27.6% |
| Time on market | 5 days slower | 7 days slower | 4 days slower | 6 days slower |