

Highlights
- Property taxes are growing due to increased home values and changes to local tax rates. The median tax bill in the U.S. in 2024 was $3,500, up 2.8% from 2023.
- Tax growth varies widely state to state, including some states where tax burdens are outpacing home price growth and others where property taxes are falling even as homes appreciate in value.
- We estimate that over 40% of properties nationwide could save $100 or more by protesting their assessment value, with a median savings of over $500.
- Some states have more opportunities for tax protesting than others, due to high effective tax rates and high variability in assessment values.
Homeownership has become even more difficult in the years following the COVID-19 pandemic due to rising home prices, high mortgage rates, and rapid growth in a wide array of additional expenses like HOA fees, homeowners insurance, and property taxes. In this report, we focus on property taxes, highlighting how and where they have changed as well as proposing a solution for some homeowners to get some relief by protesting their tax assessment.
If you think that you pay too much in property taxes, Realtor.com® has just launched a new feature that compares your home’s assessment value to similar homes and provides a set of comparable property assessments for you to use as evidence in your appeal. This exciting new tool is free to use and can be found here.
Property taxes are growing with home values
Property taxes are levied by counties, municipalities, and some state governments. They often provide funding for essential public services like schools, health care, and transportation infrastructure. An annual property tax bill is calculated by multiplying the tax rate from each taxing entity by the assessed value of the property. Assessment values vary widely from jurisdiction to jurisdiction and are subject to special modifications like homestead exemptions, but they generally loosely correspond to the market value of the property. Higher assessed values lead to higher property tax bills, so the tax burden on American homeowners has grown significantly in recent years, along with the market values of those homes.
From 2023 to 2024, the median property in the U.S. saw its property tax bill grow by 2.8% and 73.6% of properties had tax increases year to year. The median tax burden in 2024 was $3,500, up from $3,349. This is mostly due to home price appreciation, as the median home’s assessed value increased by 2% over the same period and 59.5% of properties nationwide had their assessment value go up. Interestingly, 23.4% of properties saw their tax bill go up from 2023 to 2024 without their assessment value increasing, suggesting a tax rate hike independent of home valuation.
This effect is far from uniform across the country. These five states saw the largest percentage increase in property taxes from 2023 to 2024.
| State | Median Tax Burden YoY | Median Assessment Value YoY |
| Georgia | 15.6% | 4.8% |
| Texas | 7.8% | 10.0% |
| Maine | 5.9% | 0.8% |
| New Hampshire | 5.6% | 0.0% |
| Wisconsin | 5.5% | 0.0% |
With the exception of Texas, the tax burdens grew at a faster pace than assessment value, suggesting that Georgia, Maine, New Hampshire, and Wisconsin saw tax rate hikes. The Lone Star State, on the other hand, actually saw tax burdens grow at a slower rate than assessment values, signaling a cut in the effective tax rate. On the other hand, these five states saw decreases or no change to their median tax burden from 2023 to 2024.
| State | Median Tax Burden YoY | Median Assessment Value YoY |
| Nebraska | -15.3% | 8.3% |
| Michigan | -12.9% | 12.8% |
| Kentucky | -1.1% | 0.0% |
| Washington | -0.2% | 8.2% |
| Tennessee | 0.0% | 0.0% |
Nebraska and Michigan stand out as having healthy growth in home values at the same time that property taxes fell significantly, meaning that effective tax rates there sharply decreased. The same is true for Washington to a lesser extent, while Tennessee and Kentucky held steady year over year.
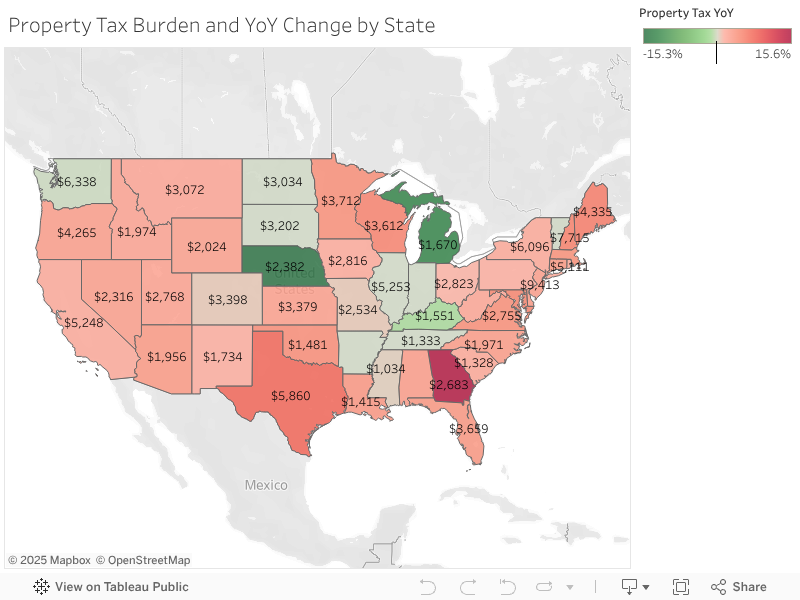
The reality is that as properties become more valuable, their tax obligations increase, but that does not mean that all tax increases are naturally occurring. In some places, local governments are bumping up effective tax rates. In others, assessment values are out of line with the true market values of homes, which presents homeowners with an opportunity to save. In the map below, you can see the median property tax burden in each state, with the color corresponding to how much that value grew from 2023 to 2024.
Nearly half of U.S. homeowners could save by protesting their property taxes
The best way to get a break on property tax, assuming that all relevant exemptions are in place, is to protest a home’s assessed value. In this analysis, we compare each property’s assessed-to-market value ratio against the average ratio for homes in the same county. Homes with a relatively high assessed value are identified, and we simulate a situation in which their assessed value is lowered to match the average assessed-to-market value ratio for their county instead. If the property could save $100 or more at this hypothetical assessment, we tag it as a potential beneficiary of property tax protesting.
Nationwide, we find that 40.5% of properties could benefit from lowering their assessed value to their market value times their county’s average assessed-to-market value ratio, keeping each property’s effective tax rate the same. This large subset of the housing stock could see significant savings. The median property identified by this methodology could save over $539 per year, a 15.4% reduction of the median property tax bill of $3,500 in 2024.
Again, the opportunities for property tax savings vary across the country. Below are the five states with the highest share of properties that could benefit from property tax protesting.
| State | Share of Homes Identified for Protesting | Median Savings From Protesting |
| Texas | 51.2% | $606.66 |
| South Dakota | 48.3% | $431.23 |
| California | 47.8% | $1,875.12 |
| Iowa | 47.3% | $368.91 |
| Illinois | 46.5% | $629.76 |
Texas, California, and Illinois are relatively high-tax states, so even a small change to assessment values could lead to significant property tax savings. It is important to note that in states like California, where annual assessment value increases are , additional variation in assessment values between similar properties in the same county is created. This will lead to more instances in which, for a given property, there could be comparable properties assessed at much lower rates. This could inflate the number of properties that look like they are overassessed, but really just have comparable properties that are locked into lower valuations by the cap. South Dakota and Iowa are middle of the pack in terms of effective tax rates, but higher variation in assessment values in these states means that protesting could lead to tax savings for more homeowners there.
Methodology
For the year-over-year analysis, tax records from 2023 and 2024 are collected from properties only where both years are available. Data is from the Realtor.com tax assessment database. Year-over-year changes are calculated at the property level and aggregated by state from there. Due to missing data, Vermont, Indiana, Illinois, Arkansas, Washington, DC, North Dakota, and South Dakota were excluded from the year-over-year analysis. Potential savings from property tax protesting are calculated by comparing the actual tax bill for a property for the most recent tax year against the product of that property’s effective tax rate (actual tax bill divided by actual assessment value) and the property’s hypothetical assessment value (market value multiplied by the average assessment-to-market value ratio for the property’s county). Market values are the median of the most recent valuations from several valuation vendors.