May 2023 New Home Sales
What Happened This Month:
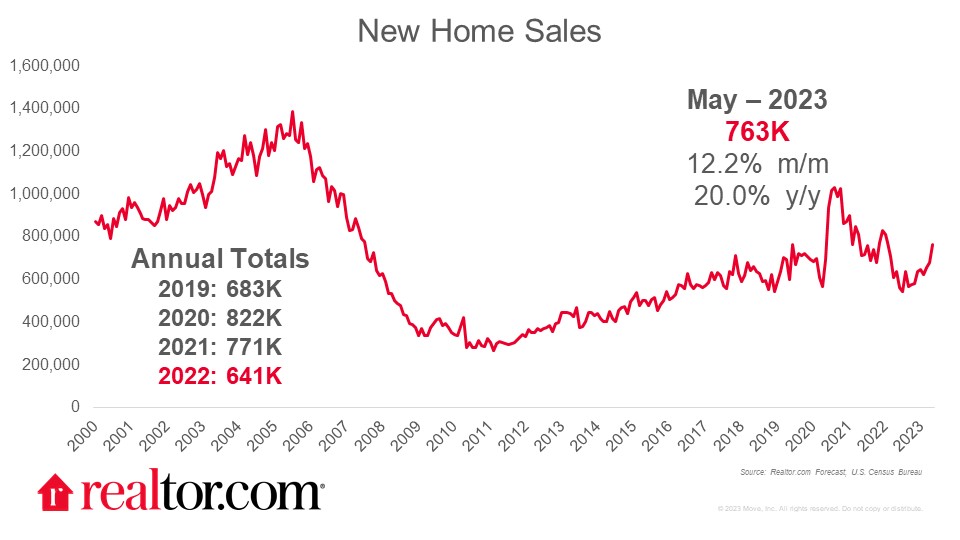
surged in May, jumping 12.2% from April to an annual rate of 763,000 new home sales. Despite downward revisions to prior months’ new home sales data, this month’s pace is up a sizable 20.0% compared to last May, the highest level since February 2022. New home sales were up by double-digits from one month ago in all regions except the Midwest (+4.1%). Compared to one year ago, new home sales more than doubled in the Northeast (+110.5%) and surged in both the Midwest (+40.0%) and South (+22.0%) despite slipping in the West (-0.6%). The different regional performance reflects varying economic fundamentals including the strength of local labor markets and degree of housing affordability. As a result, we see similar regional patterns in the Realtor.com May Hottest Markets and May Rental Trends report.
What Does this Mean for the Home Shoppers:
With existing home inventory limited, and the growth that began last year stalling out, new construction offers a much needed relief valve for potential buyers. This is especially true for homes at the most affordable price points, where the . Fortunately, builders are getting the message, and revised data show that after slipping below 10% in 2022, the share of new homes sold that are priced under $300,000 is climbing. In May, early estimates suggest that homes in this price tier made up 17% of sales, the highest share since December 2021 (18%). The shift toward homes at more affordable price points is also a contributor to the 7.6% decline in median sales price from a year ago. The median sales price of $416,300 was down from a year ago for a second consecutive month.
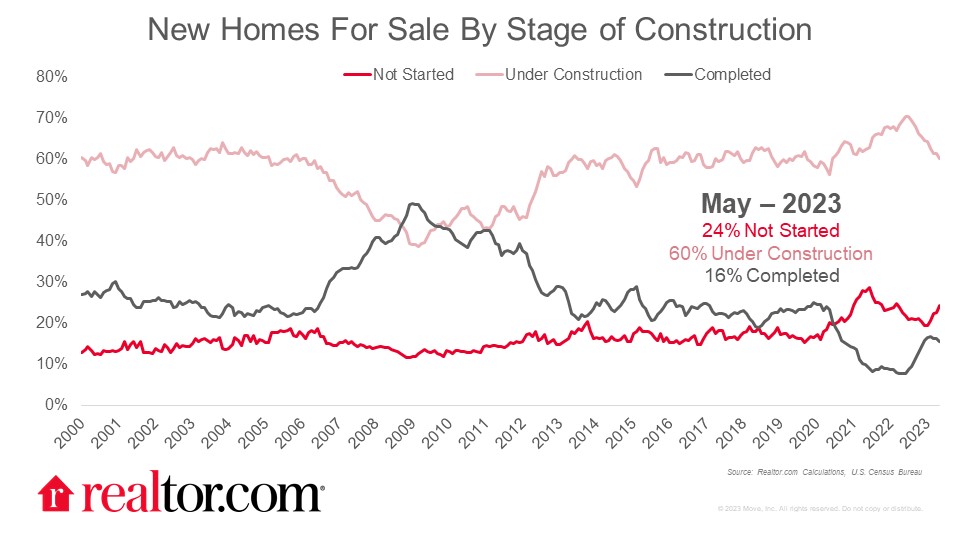
Sales Pick Up Eats Into Supply:
Amid surging sales, the measured availability of new homes slipped to 6.7 months. This is the smallest months of supply since February 2022, a sign that demand is keeping pace with supply. The composition of inventory also reflects buyer demand. Not yet started homes still make up a larger share of current inventory (24% in May) than was the case before 2020 (typically 15% to 20%). Meanwhile, completed homes are less available (16% in May) than was typical from 2013 to 2020 (20% to 30%). And the typical completed home was for sale just 2.7 months after completion, less than the 2.7 to 4.0 that was typical from 2013 to 2020. This means that while a new home may be a good option for many home shoppers frustrated by limited options among existing homes for sale, patience may be required in the market for a new home as well.