

Highlights
-
March 2025 rental trends
-
- March 2025 marks the 20th month of year-over-year rent decline in a row for 0-2 bedroom properties. Asking rents dipped by $20, or -1.2%, year over year.
- The median asking rent in the 50 largest metros registered at $1,694, up by $4 from last month and $65 lower than its August 2022 peak.
- Median rent declined in all size categories with larger percentage declines in larger-sized units: studio: $1,407, down $17 (-1.2%) year over year; 1-bed: $1,577, down $17 (-1.1%) year over year; 2-bed: $1,878, down $26 (-1.4%) year over year.
-
Five years since the COVID-19 pandemic onset
-
- March 2025 marks the fifth year since the onset of the pandemic, and San Francisco, CA, remains the only market where the median asking rent is still below pre-pandemic levels.
-
Where tariffs could hit multifamily construction hardest
- Markets like Milwaukee, WI; Oklahoma City, OK; and Memphis, TN—which saw the fastest growth in permitted multifamily homes—are expected to be hit the hardest by the 25% tariffs due to anticipated higher construction costs.
March 2025 Rental Trends
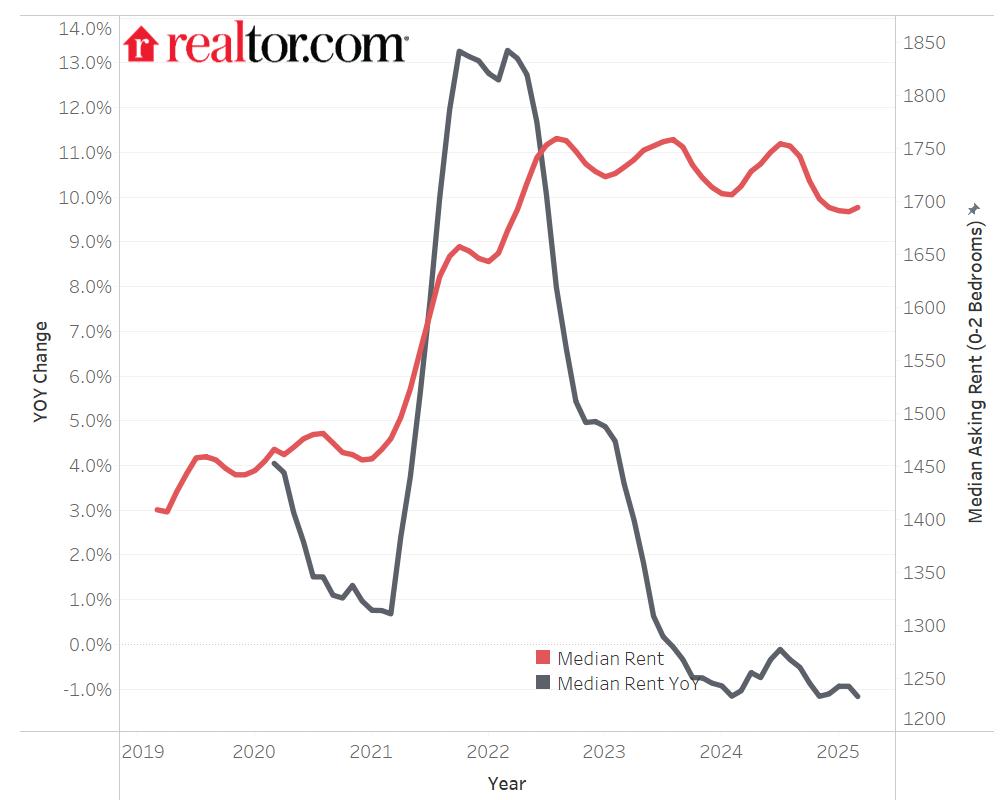
In March 2025, the U.S. median rent recorded its 20th consecutive year-over-year decline, dropping 1.2% for 0-2 bedroom properties across the 50 largest metropolitan areas. The median asking rent stood at $1,694, reflecting a modest $4 increase from the previous month. This uptick aligns with the typical seasonal trend, where rents tend to rise in the spring and summer before softening in the fall and winter.
March 2025 marks the fifth year since the onset of the pandemic. The median rent has risen 20.2%, from $1,409 in March 2019 (pre-pandemic) to $1,694 in March 2025. During this period, Pittsburgh, PA (47.9%), led the Northeast in rental growth, while Tampa, FL (45.7%), saw the fastest increases in the South. In the Midwest, Indianapolis, IN (34%), emerged as the fastest-growth market, and in the West, Sacramento, CA (30.6%), experienced the highest rent hikes. Meanwhile, San Francisco, CA (-1.6%), remains the only market where the median asking rent is still below pre-pandemic levels.
As of March 2025, the median asking rent has been declining for 20 consecutive months, now standing $65 (or 3.7%) below its peak in summer 2022. This downward trend is largely driven by the continued influx of new multifamily homes entering the market, which has helped suppress rental prices. However, this relief may not be long-lived. The recent imposition of 25% tariffs on all imported steel and aluminum could disrupt the supply of multifamily housing, potentially reversing the trend and driving rents higher. In the second part of this report, we will explore which multifamily markets are most likely to be affected by this policy.
Figure 1: Rents Decline Again, but Nationwide Rent Is 3.7% Below 2022 Peak
Larger units saw larger rent declines
In March, the median asking rent for two bedroom units dropped 1.4% year over year, marking the 22th consecutive month of annual declines. The median rent for two bedrooms was $1,878 nationally, $81 (-4.1%) lower than the peak seen in August 2022. Nevertheless, larger unit rents had the highest growth rate over the past six years, up by $340 (22.1%).
The rent for one-bedroom units slipped 1.1% in March 2025 on a year-over-year basis, standing at $1,577. It was the 22nd consecutive month of annual declines. It was $81 (-4.9%) lower than the peak observed during August 2022, but still $246 (18.5%) higher than in March 2019.
In March 2025, the median asking rent for studios fell by 1.2%, marking the 19th consecutive month of annual declines. The median rent of studios was $1,407 in March, down by $80 (-5.4%) from its peak seen in October 2022. Nevertheless, the median asking rent for studios was still $196 (16.2%) higher than six years ago.
Figure 2: Larger Units Saw Larger Rent Declines
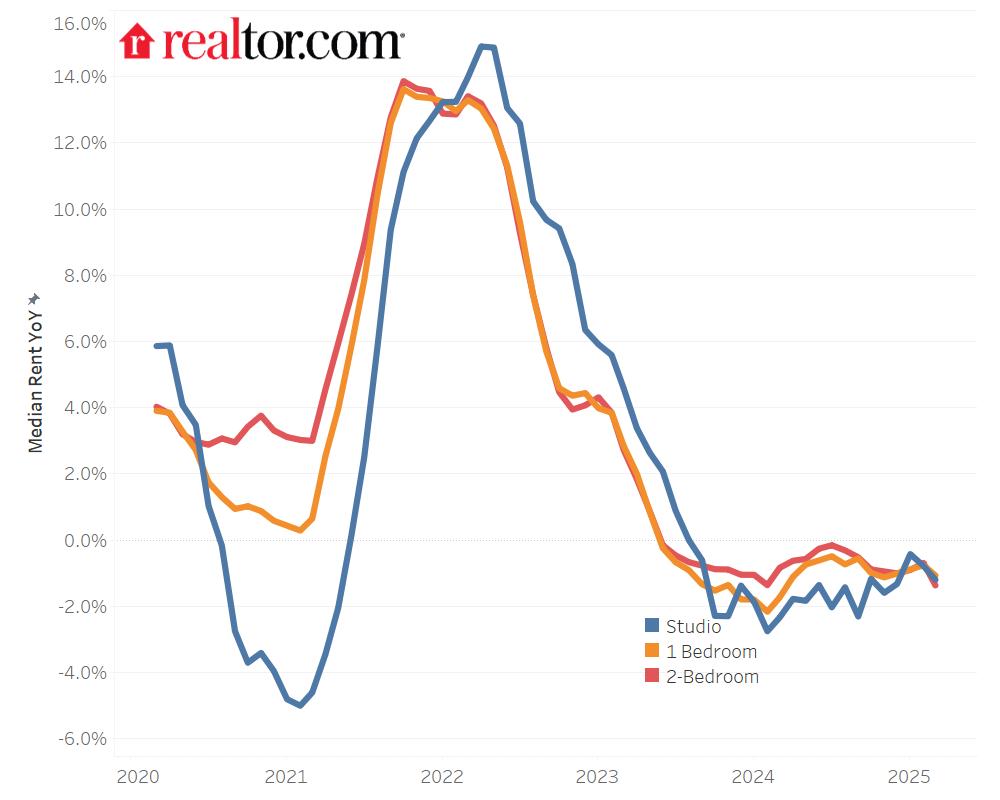
Table 1: National Rents by Unit Size
| Unit Size | Median Rent | Rent YoY | Rent Change – 6 Years |
| Overall | $1,694 | -1,2% | 20.2% |
| Studio | $1,407 | -1.2% | 16.2% |
| 1-Bedroom | $1,577 | -1.1% | 18.5% |
| 2-Bedroom | $1,878 | -1.4% | 22.1% |
Markets most affected by the 25% tariffs
The recently imposed , important multifamily building materials, could significantly affect the multifamily housing supply by driving up construction costs. These rising expenses might discourage builders from breaking ground and force developers to delay or halt projects. Ultimately, these added costs are likely to be passed on to renters, pushing rental prices higher.
Markets that experienced rapid growth in permitted multifamily homes are expected to be hit the hardest, as developers and builders may postpone or even cancel new projects. Table 3 highlights markets where multifamily permits for projects with five or more units were higher by double or even triple digits in 2024 compared with the 2019–23 average.
Table 2: Markets With Fast-Growing Multifamily Permits Face the Greatest Impact
| Markets | Multifamily Units Permitted 2024 | Multifamily Units Permitted vs 5-Year Baseline |
| Milwaukee-Waukesha, WI | 1,884 | 101.3% |
| Oklahoma City, OK | 581 | 90.4% |
| Memphis, TN-MS-AR | 1,089 | 39.5% |
| Cleveland, OH | 720 | 37.9% |
| Columbus, OH | 7,195 | 32.7% |
| Atlanta-Sandy Springs-Roswell, GA | 13,937 | 31.5% |
| Cincinnati, OH-KY-IN | 2,534 | 29.9% |
| Birmingham, AL | 556 | 22.1% |
| San Diego-Chula Vista-Carlsbad, CA | 7,244 | 18.8% |
However, markets with declining permitted multifamily won’t be spared either. Rising construction costs could further dampen new development plans, restricting supply and continuing to exert upward pressure on rental prices.
Appendix: Rental Data—50 Largest Metropolitan Areas—March 2025
| Median Asking Rent | YoY Change | |
| Atlanta-Sandy Springs-Roswell, GA | $1,571 | -2.9% |
| Austin-Round Rock-San Marcos, TX | $1,471 | -4.5% |
| Baltimore-Columbia-Towson, MD | $1,806 | 1.1% |
| Birmingham, AL | $1,170 | -4.6% |
| Boston-Cambridge-Newton, MA-NH | $2,951 | 0.4% |
| Buffalo-Cheektowaga, NY | NA | NA |
| Charlotte-Concord-Gastonia, NC-SC | $1,522 | -0.3% |
| Chicago-Naperville-Elgin, IL-IN | $1,787 | -2.2% |
| Cincinnati, OH-KY-IN | $1,291 | -2.5% |
| Cleveland, OH | $1,161 | -3.5% |
| Columbus, OH | $1,204 | 1.3% |
| Dallas-Fort Worth-Arlington, TX | $1,461 | -2.3% |
| Denver-Aurora-Centennial, CO | $1,767 | -6.3% |
| Detroit-Warren-Dearborn, MI | $1,311 | 2.4% |
| Hartford-West Hartford-East Hartford, CT | NA | NA |
| Houston-Pasadena-The Woodlands, TX | $1,357 | -2.0% |
| Indianapolis-Carmel-Greenwood, IN | $1,289 | -1.8% |
| Jacksonville, FL | $1,510 | -2.8% |
| Kansas City, MO-KS | $1,371 | 5.3% |
| Las Vegas-Henderson-North Las Vegas, NV | $1,453 | -2.3% |
| Los Angeles-Long Beach-Anaheim, CA | $2,709 | -2.8% |
| Louisville/Jefferson County, KY-IN | $1,234 | -1.5% |
| Memphis, TN-MS-AR | $1,180 | -3.0% |
| Miami-Fort Lauderdale-West Palm Beach, FL | $2,326 | -1.7% |
| Milwaukee-Waukesha, WI | $1,649 | 0.7% |
| Minneapolis-St. Paul-Bloomington, MN-WI | $1,491 | -1.4% |
| Nashville-Davidson–Murfreesboro–Franklin, TN | $1,525 | -2.0% |
| New Orleans-Metairie, LA | NA | NA |
| New York-Newark-Jersey City, NY-NJ | $2,967 | 5.6% |
| Oklahoma City, OK | $1,012 | 1.8% |
| Orlando-Kissimmee-Sanford, FL | $1,679 | -0.4% |
| Philadelphia-Camden-Wilmington, PA-NJ-DE-MD | $1,744 | -1.9% |
| Phoenix-Mesa-Chandler, AZ | $1,492 | -3.7% |
| Pittsburgh, PA | $1,452 | -0.1% |
| Portland-Vancouver-Hillsboro, OR-WA | $1,658 | -3.3% |
| Providence-Warwick, RI-MA | NA | NA |
| Raleigh-Cary, NC | $1,477 | -3.3% |
| Richmond, VA | $1,489 | -0.3% |
| Riverside-San Bernardino-Ontario, CA | $2,063 | -3.6% |
| Rochester, NY | NA | NA |
| Sacramento-Roseville-Folsom, CA | $1,863 | -1.8% |
| San Antonio-New Braunfels, TX | $1,239 | -1.7% |
| San Diego-Chula Vista-Carlsbad, CA | $2,667 | -5.8% |
| San Francisco-Oakland-Fremont, CA | $2,702 | -2.9% |
| San Jose-Sunnyvale-Santa Clara, CA | $3,339 | 2.0% |
| Seattle-Tacoma-Bellevue, WA | $1,960 | -1.2% |
| St. Louis, MO-IL | $1,314 | -0.2% |
| Tampa-St. Petersburg-Clearwater, FL | $1,738 | 0.2% |
| Virginia Beach-Chesapeake-Norfolk, VA-NC | $1,493 | -0.9% |
| Washington-Arlington-Alexandria, DC-VA-MD-WV | $2,291 | 2.6% |
Methodology
Rental data as of March 2025 for studio, 1-bedroom, or 2-bedroom units advertised as for rent on Realtor.com. Rental units include apartments as well as private rentals (condos, townhomes, single-family homes). We use rental sources that reliably report data each month within the 50 largest metropolitan areas. Realtor.com began publishing regular monthly rental trends reports in October 2020 with data history stretching back to March 2019.