

Highlights
- June 2024 marks the 11th year-over-year rent decline in a row for 0-2 bedroom properties observed since trend data began in 2020. Asking rents dipped by $7 (-0.4%) year over year.
- The median asking rent in the 50 largest metros registered at $1,743, up by $13 from last month but still down $11 from its August 2022 peak.
- Median rent declined in all size categories with larger declines in smaller-sized units: Studio: $1,463, down $18 (-1.2%) year over year; 1-bed: $1618, down $18 (-1.1%) year over year; 2-bed: $1,939, down $6 (-0.3%) year over year.
- Compared with June 2019, rents are up the most in Tampa, FL. Renters spend an additional $496 per month, or 39.5% more, if they move today compared with pre-pandemic levels.
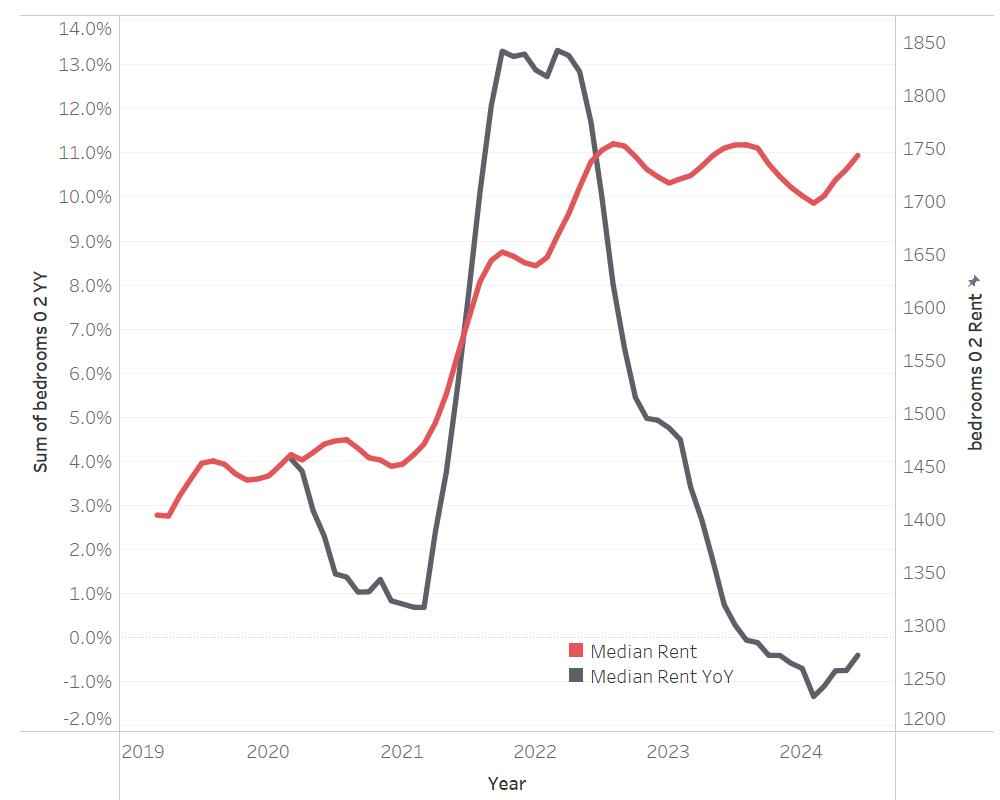
In June 2024, the U.S. median rent continued to decline year over year for the 11th month in a row, down $7 (-0.4%) for 0-2 bedroom properties across the top 50 metros, slower than the rate seen in May 2024. The median asking rent was $1,743, up by $13 from last month following a typical seasonal trend.
Despite the 11th month of decline, the U.S. median rent was just $11 less (-0.6%) than the peak seen in August 2022. Notably, it was still $305 (21.2%) higher than the same time in 2019 (pre-pandemic), but this increase is roughly on par with what has occurred in overall consumer prices (up 22.6% in the five years ending June 2024) and pales in comparison to the 52.6% increase in the median price per square foot of for-sale home listings in the five years ending June 2024.
Figure 1: Rents Decline Again, but Nationwide Rent Is Just 0.6% Below 2022 Peak
All units saw waning rent declines
In June 2024, the median asking rent for two-bedroom units dropped 0.3%, a smaller dip than the rate seen in May, but still the 12th consecutive month of annual declines. The median rent for two bedrooms was $1,939 nationally, $14 lower (-0.7%) than the peak seen in August 2022. Nevertheless, larger-unit rents had the highest growth rate over the past five years, up by $363 (23.0%).
The rent for one-bedroom units slipped 1.1% in June 2024 on a year-over-year basis, marking the 13th decline in a row and also a slightly slower pace compared with the decline of 1.2% in May. The median rent was $1,618, $36 lower (-2.2%) than the peak observed last August, but still $264 (19.5%) higher than in June 2019.
In June 2024, the median asking rent for studios fell by 1.2%, marking the 10th consecutive month of annual declines. The median rent of studios was $1,463 in June, down by $30 (-2.0%) from its peak in October 2022. Nevertheless, the median asking rent for studios was still $219 (17.6%) higher than five years ago.
Figure 2: All Units Saw Waning Rent Declines
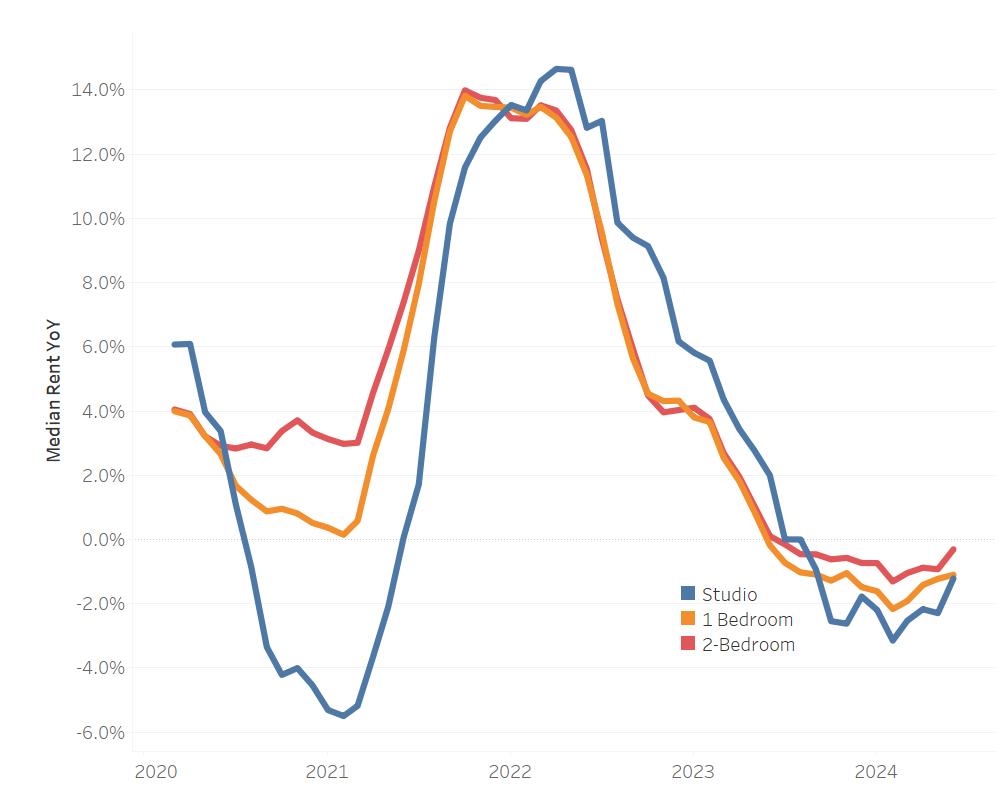
Table 1: National Rents by Unit Size
| Unit Size | Median Rent | Rent YoY | Rent Change – 5 years |
| Overall | $1,743 | -0.4% | 21.2% |
| Studio | $1,463 | -1.2% | 17.6% |
| 1-bed | $1,618 | -1.1% | 19.5% |
| 2-bed | $1,939 | -0.3% | 23.0% |
Rents declined in the South, grew in the Midwest, showed mixed results on the coasts
In June 2024, the markets with the most significant year-over-year declines were all in the South, led by Austin, TX (-9.5%), San Antonio, TX (-8.2%), and Nashville, TN (-8.1%). This trend is unsurprising given the substantial increase in new rental supplies in these areas.
Meanwhile, Midwest markets continue to experience overall rent growth. Markets like Indianapolis, IN (+4.4%), Milwaukee, WI (+3.7%), and Minneapolis, MN (+3.7%), saw substantial year-over-year rent increases in June.
Populated Western metros such as Los Angeles, CA (-1.9%), and San Francisco, CA (-4.2%), continued to see year-over-year rent declines, while their Northeast coastal counterparts, such as New York, NY (+0.6%), still experienced rent growth, albeit at a slower rate than before.
Tampa, FL, leads in rent growth since pre-pandemic
In June 2024, the median asking rent for 0-2 bedroom units across the top 50 metros was $305 (21.2%) higher than in the same period in 2019 (pre-pandemic). Among the top 10 markets with the largest percentage increase in rents compared with the pre-pandemic period, five were in the South, led by Tampa, FL, and Miami, FL. For instance, in June 2024, the median asking rent in Tampa was $1,752, which is $496 (39.5%) higher than the pre-pandemic level. This means a household now needs to pay an extra $496 every month to rent a typical 0-2 bedroom unit in Tampa, equivalent to about 8.6% of a typical Tampa household’s monthly gross income.
Table 2: Top Markets Experiencing the Fastest Rent Growth vs. Pre-Pandemic
| Rank | Market | Rents June 2024 | $ Diff. vs. June 2019 | % Diff. vs. June 2019 |
| 1 | Tampa-St. Petersburg-Clearwater, FL | $1,752 | $496 | 39.5% |
| 2 | Miami-Fort Lauderdale-Pompano Beach, FL | $2,388 | $673 | 39.2% |
| 3 | Indianapolis-Carmel-Anderson, IN | $1,353 | $369 | 37.5% |
| 4 | Pittsburgh, PA | $1,484 | $404 | 37.4% |
| 5 | Sacramento-Roseville-Folsom, CA | $2,007 | $529 | 35.8% |
| 6 | Virginia Beach-Norfolk-Newport News, VA-NC | $1,542 | $378 | 32.5% |
| 7 | New York-Newark-Jersey City, NY-NJ-PA | $2,910 | $693 | 31.3% |
| 8 | Cleveland-Elyria, OH | $1,237 | $290 | 30.6% |
| 9 | Raleigh-Cary, NC | $1,546 | $355 | 29.8% |
| 10 | Birmingham-Hoover, AL | $1,316 | $298 | 29.3% |
Indianapolis, IN, was the top market in the Midwest experiencing the fastest rent growth when compared with June 2019. The median asking rent for Indianapolis was $1,353, $369 (37.5%) higher than the pre-pandemic level. This means an Indianapolis household needs to pay an extra $369 every month to rent a typical 0-2 bedroom now, which is equivalent to about 5.8% of a typical local household’s monthly gross income.
Pittsburgh, PA, outpaced New York, NY, becoming the top Northeast market for rent growth over the past five years. This trend is likely due to many people leaving expensive New York City during the COVID-19 pandemic, resulting in larger rent declines there. In contrast, Pittsburgh’s relatively affordable rent prices provided stability and maintained relatively consistent rental demand. Nonetheless, New York City remains one of the top markets for rent growth when compared with the pre-pandemic level. In June 2024, the median asking rent in Pittsburgh was $1,484, $404 (37.4%) higher than the pre-pandemic level. In other words, a household needs to pay an extra $404 every month to rent a typical 0-2 bedroom in Pittsburgh, equivalent to about 6.7% of a typical Pittsburgh household’s monthly gross income.
In the West, Sacramento, CA, experienced the fastest rent growth over the past five years. Unlike nearby San Francisco, CA, and San Jose, CA, which saw significant rent declines during the pandemic as people moved away from these expensive tech hubs, Sacramento’s proximity to these areas combined with its more affordable rental prices helped it maintain growth during this period. In fact, San Francisco is the only metro where the current rent price is lower than it was five years ago ($153, or 5.2%, lower than June 2019). In June 2024, the median asking rent for Sacramento was $2,007, $529 (35.8%) higher than the pre-pandemic level. This means a household needs to pay an extra $529 every month to rent a typical 0-2 bedroom unit in Sacramento, equivalent to about 6.9% of a typical local household’s monthly gross income.
Appendix: Rental Data – 50 Largest Metropolitan Areas – June 2024
Methodology
Rental data as of June 2024 for studio, 1-bedroom, or 2-bedroom units advertised as for-rent on Realtor.com®. Rental units include apartments as well as private rentals (condos, townhomes, single-family homes). We use rental sources that reliably report data each month within the 50 largest metropolitan areas. Realtor.com began publishing regular monthly rental trends reports in October 2020 with data history stretching back to March 2019.
With the release of its June 2024 rent report, Realtor.com incorporated a new and improved methodology for capturing and reporting more comprehensive rental listing trends and metrics. The new methodology is expected to yield a cleaner, more representative, and more consistent measurement of rental listings and trends at both the national and local levels.
The methodology has been adjusted to better represent the true cost of primary housing for renters. Most areas across the country will see minor changes with a smaller handful of areas seeing larger updates. As a result of these changes, the rental data released since June 2024 will not be directly comparable with previous releases and Realtor.com economics blog posts. However, future data releases, including historical data, will consistently apply the new methodology.