
Music City Mansions: Nashville Takes the Top Spot in Luxury Housing Market Ranking
There’s a new top luxury market this quarter in the latest Wall Street Journal/Realtor.com Housing Market Ranking. Nashville, Tennessee has ended the three-quarter reign of Portland, Maine as the number one market for luxury homes, amid an influx of affordable inland markets into the top ten.
Each quarter, Realtor.com and the Wall Street Journal team up to identify the highest performing and most attractive metro areas for luxury home purchases. We score 60 different luxury housing markets across the country in categories that include supply and demand strength, economic health, and quality of life. This summer’s ranking not only welcomed a new number one market in Nashville, it shows a new trend in the luxury home space.
Smaller, relatively affordable, inland markets with strong local economies are well-represented in the top ten luxury markets for July 2024. With interest rates hovering near 7% for most of 2024, a desire for affordability can be seen even in the luxury housing segment. Bucking this trend, obviously, is San Diego, which is large and pricey and coastal, but a luxury market mainstay. Noticeably absent from the list are Florida markets, where demand has cooled in the last year and environmental concerns are factored into our rankings. In fact, Florida markets make up half of our bottom ten.
| July 2024 Luxury Ranking | Metro Area | 90th Percentile Listing Price | Population | Unemployment Rate |
| 1 | Nashville-Davidson–Murfreesboro– Franklin, TN | $1,799,908 | 2,102,573 | 2.5% |
| 2 | St. Louis, MO-IL | $699,900 | 2,796,999 | 3.5% |
| 3 | Salt Lake City, UT | $1,425,000 | 1,267,864 | 2.9% |
| 4 | Portland-South Portland, ME | $1,850,000 | 566,329 | 2.6% |
| 5 | Pittsfield, MA | $2,700,000 | 126,818 | 3.8% |
| 6 | Boulder, CO | $3,350,000 | 326,831 | 3.3% |
| 7 | Detroit-Warren-Dearborn, MI | $799,830 | 4,342,304 | 3.8% |
| 8 | Asheville, NC | $1,600,000 | 417,202 | 2.9% |
| 9 | Coeur D’Alene, ID | $2,680,000 | 185,010 | 3.9% |
| 10 | San Diego-Carlsbad, CA | $3,513,320 | 3,269,973 | 4.5% |
Top Market Spotlight: Nashville
Music City is famous for the honky tonks on Broadway, but it is making noise in our rankings because of its strong local economy and high quality of life metrics. It has the lowest unemployment rate of any market in our analysis, thanks to the burgeoning healthcare, manufacturing, and technology industries. Nashville ranks in the top half of luxury markets in terms of commute times, the prices of daily essentials, the proliferation of small businesses, and environmental risks.
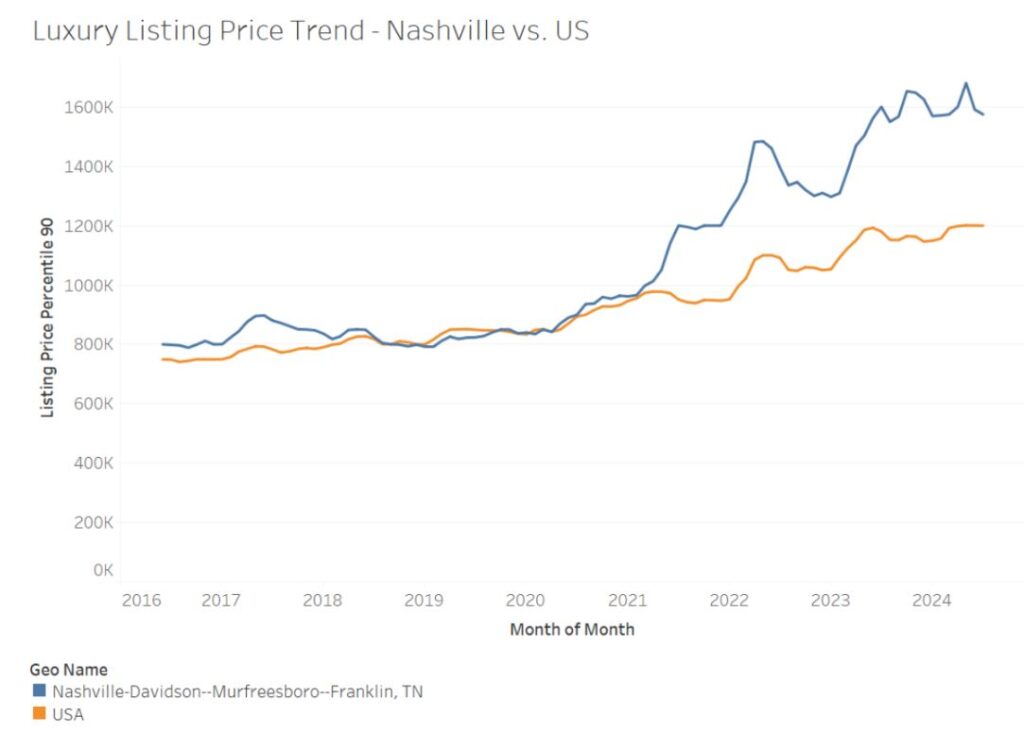
The luxury home segment in Nashville has taken off since the pandemic. From 2018 to 2021, the 90th percentile listing on the market there in terms of listed price was basically in step with the same measure at a national level. From the middle of 2021 until now, a wide gap has emerged between the price of a top-ten percent home in Nashville and a top-ten percent home nationally. Currently there’s a 31% price difference between the Nashville luxury market ($1.57M) and the national one ($1.20M).
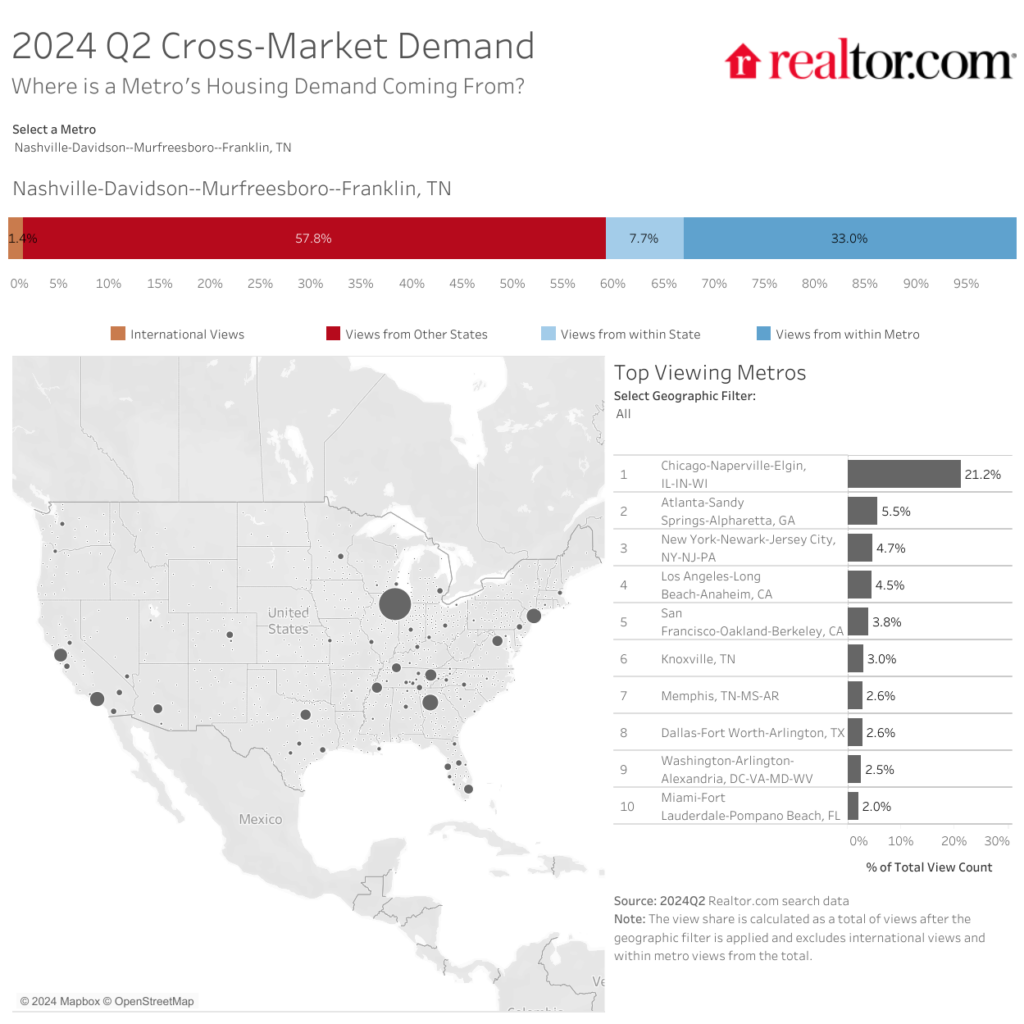
Growing demand for Nashville real estate is not just a result of people looking to move to the Music City. In fact, the share of listing views coming from within the metropolitan area has grown 3% year-over-year. Nashvillians, who are experiencing lower unemployment and higher wages than the average market in our analysis, are looking to stay in the area and break into the luxury tier of homes. This, coupled with in-migration from the metros in the map below, are driving the performance of the luxury market in Nashville.
Who’s In, Who’s Out?
Breaking into the top ten in the July rankings are Pittsfield, MA (jumping from number 25 in the last ranking to number 5 in the newest), Asheville, NC (from 19 to 8), and Couer D’Alene, ID (from 21 to 9). These three locales boast a lower cost of living, shorter commutes, and lower unemployment rates than most of the other metros considered. These mountain towns with easy access to outdoor recreation offer a high quality of life away from the hustle and bustle of large cities and the coast. While the 90th percentile price of listings jumped over 40% year-over-year in Pittsfield, Couer D’Alene had more modest growth at 17% and the top tier entry price of listings in Asheville has actually fallen 7%.
The markets they replaced in the top ten from the April rankings are Atlanta, GA (previously number 5 but falling to 12) Santa Maria-Santa Barbara, CA (from 9 to 16) and Minneapolis-St. Paul, MN (from 10 to 15). Two of these fallen markets are large cities where the 90th percentile listing price is falling or remaining flat, and the other is a coastal market where top tier home prices are growing from what was already the most expensive metro in consideration.
Methodology
The ranking evaluates the 30 most populous core-based statistical areas, as measured by the U.S. Census Bureau and defined by March 2020 delineation standards, plus the 30 markets with the highest concentration of homes listed for more than one million dollars for eight indicators across two broad categories: real estate market (60%) and economic health and quality of life (40%). Each market is ranked on a scale of 0 to 100 according to the category indicators, and the overall index is based on the weighted sum of these rankings. The real estate market category indicators are: real estate demand (15%), based on average pageviews per property; real estate supply (15%), based on median days on market for real estate listings, median listing price trend (10%), based on annual price growth over the quarter, property taxes (10%) and climate risk to properties (10%). The economic and quality of life category indicators are: unemployment (5%); wages (5%); regional price parities (5%); the share of foreign born (5%); small businesses (5%); amenities (10%), measured as the average number of stores per specific “everyday splurge” category (coffee, upscale/specialty grocery, home improvement, fitness) per capita in an area; and commute time (5%).