

Highlights
- For the 18th consecutive month, the median asking rent price across the top 50 metropolitan areas of the United States fell on a year-over-year basis.
- The median asking rent picked up from December, reaching $1,703, and the rate of year-over-year decline moderated to -0.2%.
- Rents remain significantly higher than they were before the COVID-19 pandemic for units of all sizes, but studio rents have grown the least over the past five years despite being flat over the past year.
- Leasing the median rental unit is more affordable for the median earner than buying the median for-sale home in all but two metros: Detroit and Pittsburgh.
- Most metros have become more affordable for both buyers and renters in the past year, but 15 of them highlighted below are becoming more affordable for renters at the same time that they’re becoming less affordable for buyers.
In the first month of 2025, the median asking rent across the 50 largest U.S. metropolitan areas picked up slightly to $1,703, from $1,695 in December 2024, but it remains down 0.2% from one year ago. This marks the 18th consecutive month in which rents have fallen year over year. Rent growth has tapered off since its post-pandemic surge, but the declines have been minor. While January 2025’s rent figure is lower than both January 2024 and January 2023’s, it still exceeds January 2020 by $257 (16.1%). Even though rents are falling, renters are still feeling the pinch from the rapid rent growth of 2021 and 2022. The situation is similar in the for-sale market, where the median listing price has started to fall but remains well above its pre-pandemic benchmark.
Figure 1: Rents Pick Up in January 2025, but Remain Down Year Over Year

Studio rents flatten out year over year, larger units remain negative
This month was the first since July 2023 that 0-, 1-, and 2-bedroom unit rents were not all falling on a year-over-year basis. Just like in that month, studio rent growth has picked back up to even (0% change) year over year in January 2025 while larger units are still falling slightly. The rent for studios reached $1,423, the same as in last January, and up 11.4% since January 2020. Larger units saw rent fall below where they were in January 2024, to $1,585 for 1-bedroom units and $1,887 for 2-bedroom units. However, on a longer time horizon, these larger units have seen greater increases, with 16% and 20% growth in rents compared with January 2020 for 1- and 2-bedroom units, respectively.
Figure 2: Larger Units See Year-Over-Year Rent Declines

Table 1: National Rents by Unit Size
| Unit Size | Median Rent | Rent YoY | Rent Change – 5 Years |
| Overall | $1,703 | -0.2% | 16.1% |
| Studio | $1,423 | 0.0% | 11.4% |
| 1-Bedroom | $1,585 | -0.1% | 16.0% |
| 2-Bedroom | $1,887 | -0.2% | 20.0% |
Renting vs. buying a home: Affordability analysis
At Realtor.com, we like to keep an eye out on behalf of first-time homebuyers, the people (usually renters) who are right on the margin between renting and buying their next home. We highlighted some markets that are especially attractive to first-time buyers for 2025 as part of our forecast series, and we closely monitor responses to the question in the Fannie Mae Home Purchase Sentiment Index, which asks if respondents will rent or buy the next time they make a move.
Making a first home purchase is a major life and financial milestone for many Americans that is widely regarded as an integral part of the American dream. However, renting a home can be a financially sound and rewarding experience as well, so this month we take a look at the renting-versus-buying decision across the top 50 metros we report rents for.
In all but two markets, Pittsburgh and Detroit, it is less expensive to rent the median 0-2 bedroom rental unit than it is to purchase the median listing on a monthly cost basis. These two markets are, unsurprisingly, the two with the lowest median listing prices of our top 50 metros, with Pittsburgh at $229,700 and Detroit at $239,950.
Detroit has the 10th-lowest median rent at $1,313, and Pittsburgh is No. 16 at $1,431. The monthly mortgage payment on the median listing in these markets is just $1,199 and $1,252, respectively. These Rust Belt metros are often among our most affordable ones when it comes to buying a home, and with the share of income used on rent increasing year over year in Detroit and only falling by 0.3% in Pittsburgh, buying a home has become more economical than renting one.
Using the same analysis on last year’s data, there were six of the 50 markets where buying was less expensive than renting in January 2024. The consistent retreat of rental prices and the persistence of high mortgage rates over the past year have moved the market as a whole in a more renter-friendly direction. Also important to note is that metro-level incomes changed from 2024 to 2025, so metros in which income has grown at a faster pace than rent or listing prices will show improvements in affordability even without declines in median rent or median listing price. Similarly, mortgage rates have increased from 2024, so home purchase affordability could suffer even with listing prices going down and income going up.
In the scatter plot and tables below, we show how the rent-versus-buy decision has changed over the past year. Above the horizontal reference line at zero are four metros where more of the median earner’s income is used for rent than in 2024, and below it are the remaining metros where rent has become more affordable. To the right of the vertical reference line at zero are 18 markets where more of the median earner’s income is used to buy a home than one year ago.
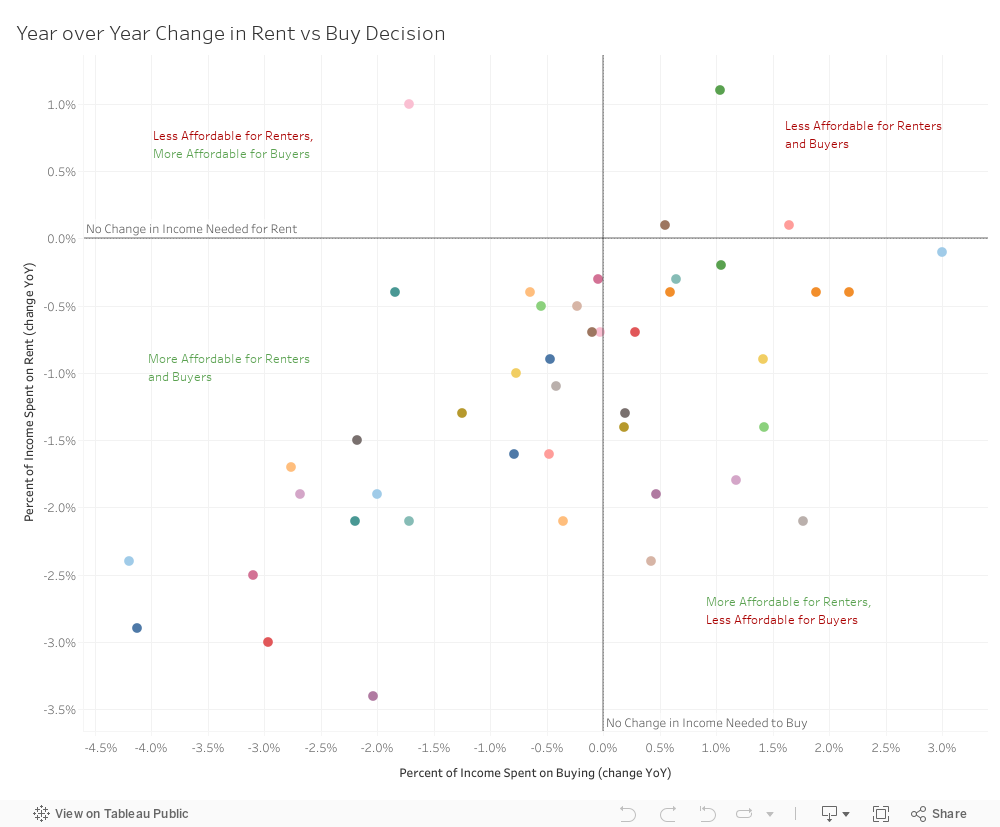
In the upper right quadrant are three metros (New York City, San Jose, CA, and Detroit) where the share of the median earner’s income used on rent and the share of the median earner’s income spent on buying a home are both growing. Most of our top 50 metros fall in the bottom left quadrant, where the amount of income spent on renting or buying a home are both falling. Most interesting are the top left quadrant, where lonely Kansas City has become more buyer-favoring with a higher share of income spent on rent and a lower share of income spent on buying, and the bottom right quadrant, where the metros in the table below are becoming more renter-favoring with a lower share of income spent on renting and a higher share of income spent on buying.
Table 2: Metros Becoming More Renter-Friendly and Less Buyer-Friendly
| Metro | Percent of Income Spent on Buying (change YoY) | Percent of Income Spent on Rent (change YoY) |
| Baltimore-Columbia-Towson, MD | 2.2% | -0.4% |
| Boston-Cambridge-Newton, MA-NH | 1.0% | -0.2% |
| Charlotte-Concord-Gastonia, NC-SC | 1.4% | -1.4% |
| Chicago-Naperville-Elgin, IL-IN | 0.2% | -1.4% |
| Houston-Pasadena-The Woodlands, TX | 0.2% | -1.3% |
| Las Vegas-Henderson-North Las Vegas, NV | 0.5% | -1.9% |
| Los Angeles-Long Beach-Anaheim, CA | 1.2% | -1.8% |
| Memphis, TN-MS-AR | 0.4% | -2.4% |
| Milwaukee-Waukesha, WI | 3.0% | -0.1% |
| Minneapolis-St. Paul-Bloomington, MN-WI | 0.6% | -0.4% |
| Philadelphia-Camden-Wilmington, PA-NJ-DE-MD | 1.4% | -0.9% |
| Pittsburgh, PA | 0.6% | -0.3% |
| Portland-Vancouver-Hillsboro, OR-WA | 0.3% | -0.7% |
| Riverside-San Bernardino-Ontario, CA | 1.8% | -2.1% |
| Virginia Beach-Chesapeake-Norfolk, VA-NC | 1.9% | -0.4% |
Interestingly, Pittsburgh appears again on this list: first, as a metro where buying is more affordable than renting, and now again as one in which renting is becoming more affordable while buying is becoming more expensive. If this trend continues, Pittsburgh will become yet another metro where renting is more affordable than buying.
In the appendix below, you can find January rent and year-over-year rent growth as well as the share of the median household’s earnings that are spent each month on renting compared with buying. In general, we say that a home is affordable if its renter/owner spends less than 30% of their income on it monthly. In some of these markets (namely Miami, New York City, Los Angeles, Boston, and San Diego), neither renting nor owning is “affordable.” In many others, renting and buying are both affordable choices.
Appendix: Rental Data—50 Largest Metropolitan Areas—January 2025
| Metro | Median Rent (0-2 Bedrooms) | YoY Change (0-2 Bedrooms) | Share of Income Spent on Rent | Share of Income Spent on Buying |
| Atlanta-Sandy Springs-Roswell, GA | $1,565 | -2.9% | 21.4% | 28.4% |
| Austin-Round Rock-San Marcos, TX | $1,467 | -4.8% | 17.2% | 30.3% |
| Baltimore-Columbia-Towson, MD | $1,786 | 0.1% | 22.5% | 23.1% |
| Birmingham, AL | $1,201 | -2.9% | 20.1% | 24.9% |
| Boston-Cambridge-Newton, MA-NH | $2,925 | 0.5% | 32.1% | 45.8% |
| Buffalo-Cheektowaga, NY | NA | NA | NA | NA |
| Charlotte-Concord-Gastonia, NC-SC | $1,520 | -1.2% | 22.4% | 32.3% |
| Chicago-Naperville-Elgin, IL-IN | $1,776 | -3.6% | 24.6% | 24.8% |
| Cincinnati, OH-KY-IN | $1,326 | -0.7% | 19.9% | 25.0% |
| Columbus, OH | $1,184 | 0.7% | 17.7% | 26.5% |
| Dallas-Fort Worth-Arlington, TX | $1,445 | -3.5% | 19.5% | 29.3% |
| Denver-Aurora-Centennial, CO | $1,796 | -5.6% | 20.2% | 33.4% |
| Detroit-Warren-Dearborn, MI | $1,313 | 1.3% | 21.7% | 20.7% |
| Hartford-West Hartford-East Hartford, CT | NA | NA | NA | NA |
| Houston-Pasadena-The Woodlands, TX | $1,359 | -1.8% | 20.7% | 28.5% |
| Indianapolis-Carmel-Greenwood, IN | $1,280 | -1.7% | 19.3% | 23.6% |
| Jacksonville, FL | $1,510 | -1.0% | 22.1% | 29.4% |
| Kansas City, MO-KS | $1,352 | 4.2% | 20.3% | 29.3% |
| Las Vegas-Henderson-North Las Vegas, NV | $1,457 | -2.2% | 24.1% | 40.4% |
| Los Angeles-Long Beach-Anaheim, CA | $2,736 | -2.6% | 35.9% | 74.7% |
| Louisville/Jefferson County, KY-IN | $1,244 | 0.5% | 20.6% | 26.4% |
| Memphis, TN-MS-AR | $1,177 | -4.3% | 21.1% | 30.8% |
| Miami-Fort Lauderdale-West Palm Beach, FL | $2,328 | -1.9% | 37.6% | 43.9% |
| Milwaukee-Waukesha, WI | $1,611 | -0.2% | 26.1% | 30.6% |
| Minneapolis-St. Paul-Bloomington, MN-WI | $1,507 | 0.2% | 18.7% | 27.5% |
| Nashville-Davidson–Murfreesboro–Franklin, TN | $1,539 | -2.5% | 21.7% | 38.6% |
| New Orleans-Metairie, LA | NA | NA | NA | NA |
| New York-Newark-Jersey City, NY-NJ | $2,973 | 5.8% | 37.6% | 49.5% |
| Oklahoma City, OK | $1,021 | 1.5% | 17.1% | 27.4% |
| Orlando-Kissimmee-Sanford, FL | $1,676 | 0.0% | 26.8% | 35.1% |
| Philadelphia-Camden-Wilmington, PA-NJ-DE-MD | $1,754 | -0.5% | 23.8% | 24.9% |
| Phoenix-Mesa-Chandler, AZ | $1,488 | -3.5% | 20.4% | 36.6% |
| Pittsburgh, PA | $1,431 | 0.2% | 23.5% | 19.7% |
| Portland-Vancouver-Hillsboro, OR-WA | $1,665 | -0.3% | 21.1% | 39.6% |
| Providence-Warwick, RI-MA | NA | NA | NA | NA |
| Raleigh-Cary, NC | $1,486 | -2.3% | 18.2% | 28.1% |
| Richmond, VA | $1,481 | -0.3% | 20.3% | 30.2% |
| Riverside-San Bernardino-Ontario, CA | $2,065 | -4.1% | 28.8% | 43.6% |
| Rochester, NY | NA | NA | NA | NA |
| Sacramento-Roseville-Folsom, CA | $1,885 | 1.0% | 24.2% | 41.1% |
| San Antonio-New Braunfels, TX | $1,238 | -2.1% | 20.3% | 27.8% |
| San Diego-Chula Vista-Carlsbad, CA | $2,695 | -4.8% | 31.4% | 57.7% |
| San Francisco-Oakland-Fremont, CA | $2,708 | -3.3% | 24.3% | 41.4% |
| San Jose-Sunnyvale-Santa Clara, CA | $3,287 | 2.4% | 25.2% | 50.7% |
| Seattle-Tacoma-Bellevue, WA | $1,969 | -0.2% | 20.8% | 40.1% |
| St. Louis, MO-IL | $1,316 | 1.4% | 19.8% | 21.6% |
| Tampa-St. Petersburg-Clearwater, FL | $1,710 | -1.6% | 28.1% | 34.0% |
| Virginia Beach-Chesapeake-Norfolk, VA-NC | $1,494 | -0.8% | 22.3% | 30.4% |
| Washington-Arlington-Alexandria, DC-VA-MD-WV | $2,247 | 2.3% | 21.9% | 29.3% |
Methodology
Rental data as of January 2025 for studio, 1-bedroom, or 2-bedroom units advertised as for rent on Realtor.com. Rental units include apartments as well as private rentals (condos, townhomes, single-family homes). We use rental sources that reliably report data each month within the 50 largest metropolitan areas. Realtor.com began publishing regular monthly rental trends reports in October 2020 with data history stretching back to March 2019. Metro-level income is sourced from Claritas, and median listing price data comes from Realtor.com listing data. Year-over-year affordability data has been recalculated with updated cost and income figures and is not directly comparable with previous iterations of the rent-versus-buy analysis.