
Flood Analysis Highlights
- The cumulative price growth of low-risk homes consistently outperformed the rate of high-risk homes, suggesting flood risks are reflected in housing prices. By 2022Q2, the difference is 1.5 ppt.
- The divergence in growth rate is more prominent in more risk-prone areas. Low-risk homes in Florida, North Carolina and South Carolina counties outpace high-risk homes by 3.6 ppt, 3.3 ppt and 5.6 ppt respectively in the last flood-related disaster season (2021Q3).1
Fire Analysis Highlights
- While the cumulative price growth of low-risk homes consistently outpaced the rate of�� high-risk homes by 3.7 ppt in 2022Q2, affordability concerns pushed up the demand for endangered homes. This pattern is more pronounced in California.
- ����he price gap per square foot between California low-risk and high-risk homes narrowed from a high of 10.5% to 8.7%, suggesting homebuyers lose the suburbs’ affordability and face higher wildfire risks by purchasing homes in risk-prone areas.��
Flood Risks Generate Impacts on Housing Prices
Realtor.com analyzed median sale prices per square foot for homes with different flood factors designated by our partners at in 271 counties across 41 states between 2016Q1 and 2022Q2. We define a low-risk home as a property with a flood factor ranging between 1 and 4, and a high-risk home as a property with a flood factor rate between 5-10. We excluded luxury homes, defined as those having sale prices within the top 10% in their respective quarter, to account for the sometimes very different real estate market trends for these types of homes.��
We found that between 2016Q1 and 2022Q2, cumulative price growth for low-risk homes consistently outpaced the rate among high-risk homes, suggesting flood risks are reflected in housing prices. By 2022Q2, the cumulative price growth of low-risk homes across all counties was 72.0%, 1.5 percentage points higher than the rate of high-risk homes. During the last flood-related disaster season (2021Q3), the growth rate gap between low-risk and high-risk homes was 1.7 percentage points.
Figure 1: Median Price per Square Foot, All Counties

Figure 2 shows the Top 10 counties where high-risk homes experienced the largest cumulative price growth gap compared to low-risk homes. It may not be surprising that the high-risk homes with the slowest price appreciation clustered in counties from Florida, Texas, Georgia, New Jersey, and North Carolina. However, there is sometimes diversity in the price growth trends within a state. For example, high-risk homes in Walton County, FL, saw the slowest cumulative price growth compared to safer homes (58 percentage points less). However, in Pasco County, FL, high-risk homes outpaced low-risk homes by 39 percentage points cumulatively. In New Jersey, Cape May County and Camden County have seen high-risk homes appreciate 36 and 29 percentage points less over these six years. In contrast, high-risk homes in Essex County and Monmouth County saw sale prices grow by 56 and 43 percentage points more over this period.��
Figure 2: Growth Gap in Sale Price per Sqft, High-Risk vs. Low-Risk Homes (Top 10 Counties)

Homebuyers Have Stronger Demands for Safer Homes in Endangered Areas��
The divergence in growth rate between low-risk and high-risk homes correlates with homebuyers’ risk awareness. In other words, when shopping in more risk-prone regions, homebuyers’ desire to live in safer homes can expand the price growth gap between the two types of homes. For example, eastern coastal regions are hit most by flood-related disasters. 2 As a result, the cumulative growth rate gap between the low-risk and high-risk homes in these counties is wider than counties from other parts of the country over time, reflecting homebuyers’ stronger demands for safer homes in endangered areas. For example, during the last flood-related disaster season, the growth rate gap between high-risk and low-risk homes was 2.8 percentage points in the eastern coastal counties, whereas the�� gap was 0.9�� percentage points in other counties.3
Figure 3: Median Price per Square Foot, Eastern Coastal Counties vs. Other Counties

During the past ten years, Florida (24 times), North Carolina (16 times), and South Carolina (13 times) are the top 3 states along the eastern coast having the highest number of flood-related federally declared disasters. They are also among the states suffering the highest damage costs. Florida had over 51 billion dollars in damage caused by flood-related disasters during the past ten years, North Carolina sustained over 22 billion dollars, and South Carolina suffered a total loss of over 4 billion dollars.4 As a result, the growth gaps between low-risk and high-risk homes in counties within these states are wider than average. During the last flood-related disaster season, the gap between low-risk and high-risk homes was 3.6 percentage points in Florida, 3.2 percentage points in North Carolina, and 5.6 percentage points in South Carolina (vs. 1.7 percentage points in all counties).
Rising Demands for Homes with High Fire Risks
Realtor.com analyzed median sale prices per square foot for homes with different fire factors designated by our partners at in 94 counties across 18 states between 2016Q1 and 2022Q2. A high-risk home is a property with a fire factor ranging between 1 and 4, and a low-risk home is a property with a fire factor rate between 5-10. We excluded luxury homes, defined as those having sale prices within the top 10% in their respective quarter, to account for the sometimes very different real estate market trends for these types of homes.�� We found that the cumulative price growth for low-risk homes consistently outpaced the rate among high-risk homes, suggesting wildfire risks are priced in housing markets. By 2022Q2, the cumulative price growth of low-risk homes across all counties was 89.1%, 3.7 percentage points higher than the rate of high-risk homes. During the last wildfire season (2021Q3), the growth rate gap between low-risk and high-risk homes was 3.7 percentage points.5
Figure 4: Median Price per Sqft, All Counties

In 2021Q2, the high-risk homes started to catch up with the rate of low-risk homes, implying rising demands for more endangered homes. This pattern is more pronounced in California, the state with the highest number of properties at wildfire risk and the highest number of wildfires and acres burned in recent decades.��
In California, the difference in cumulative price growth between high-risk and low-risk homes was first narrowed to 3.1 percentage points in 2021Q1, expanded to 3.5 percentage points in 2021Q3, and was tightened again to 2.1 percentage points in 2021Q4. The temporary divergence in the third quarter could be a seasonal phenomenon, as nine wildfire disasters in California were declared at the federal level during this period.6 This temporary expansion also reveals the impact of homebuyers’ risk awareness on home prices. When there is more news coverage of wildfire events, buyers may place greater weight on this potential concern.
Figure 5: Median Price per Sqft, California County

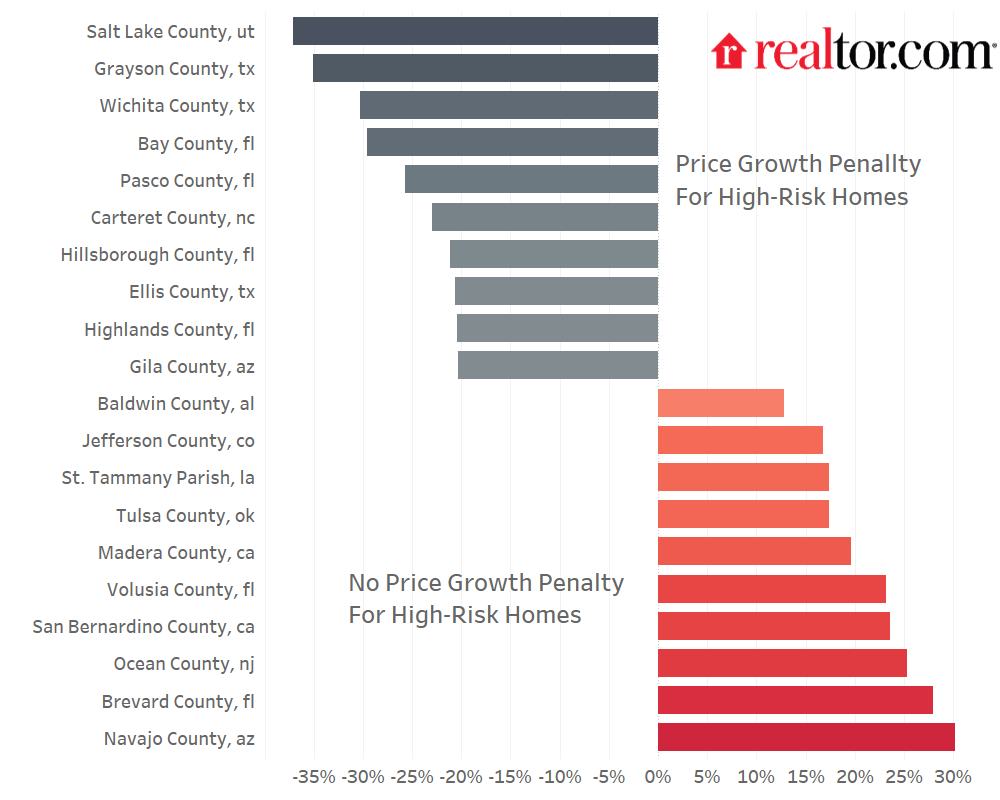
Figure 6 provides another piece of evidence that supports our findings. While California is the state that is hit most by wildfire, none of the top 10 counties with the slowest high-risk home price appreciation (vs. low-risk home) was in California. In contrast, high-risk homes in San Bernardino County, CA and Madera County, CA appreciated faster than low-risk homes, suggesting stronger demands for these risk-prone homes.��������
Figure 6: Growth Gap in Sale Price per Sqft, High-Risk vs. Low-Risk Homes (Top 10 Counties)
High-risk California homes are losing their price advantages
As affordability remains a primary concern in home purchasing, it may not be surprising that high-risk homes become more attractive to homebuyers as they are more likely to be in the suburbs with more affordable prices. Table 1 shows that in all our sample counties, the median sales price per square foot of low-risk homes is consistently higher than that of high-risk homes. This pattern is more pronounced in California, one of the states where home buyers face the greatest affordability concerns.��
Table 1. Median price per square foot
| All Counties�� | California Counties | |||||
|
Low Risk Homes |
High Risk Homes | % Diff (Low vs. High) | Low Risk Homes | High Risk Homes |
% Diff (Low vs. High) |
|
|
2016Q2 |
$136 | $133 | 1.8% | $210 | $194 | 8.3% |
|
2017Q2 |
$146 | $143 | 2.3% | $227 | $208 | 9.2% |
|
2018Q2 |
$158 | $154 | 2.7% | $246 | $225 | 9.4% |
|
2019Q2 |
$162 | $156 | 3.5% | $250 | $228 |
10.1% |
| 2020Q2 | $171 | $165 | 3.0% | $260 | $236 |
10.5% |
| 2021Q2 | $204 | $197 | 3.7% | $314 | $287 |
9.4% |
| 2022Q2 | $244 | $237 | 3.0% | $362 | $333 |
8.7% |
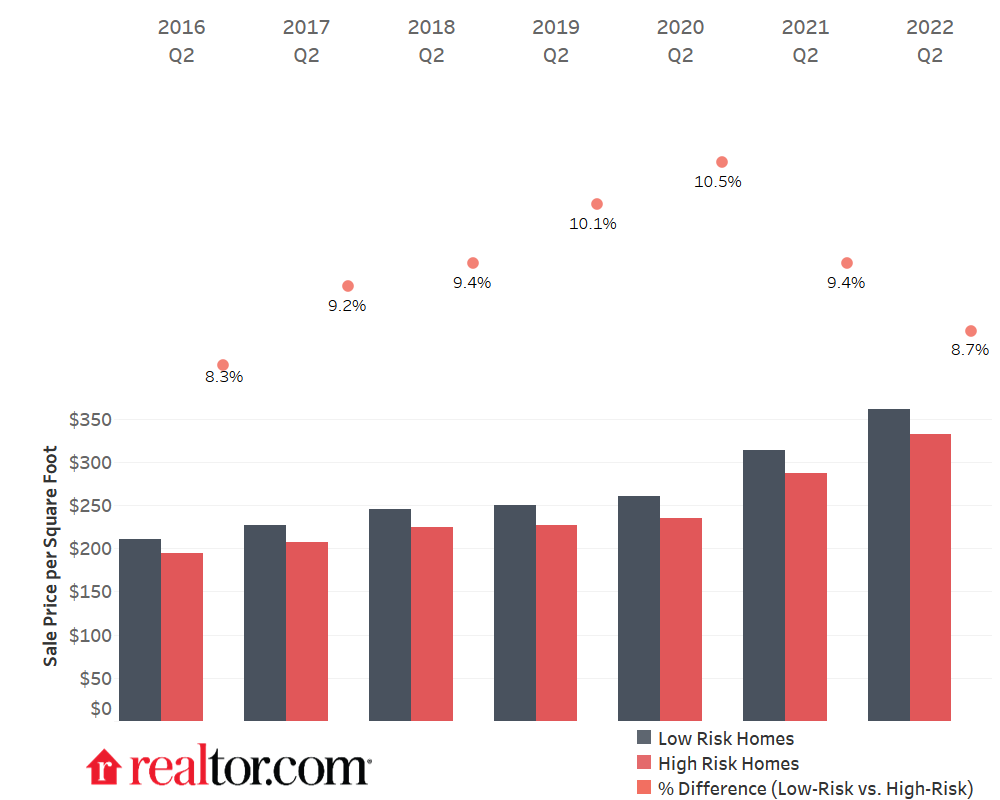
However, the faster appreciation in high-risk homes has eaten into their price advantage against low-risk homes. In California, the gap between low-risk homes and high-risk homes narrowed from a high of 10.5% in 2020Q2 to 8.7% in 2022Q2, suggesting that some of the comparative price advantages of high-risk homes have gradually disappeared over time. In other words, buyers who prefer to live in California may lose the suburbs’ affordability and face higher wildfire risks by purchasing homes in those areas.
Figure 7: Median price per square foot
�ѱ�ٳ�ǻ�DZ��Dz�����
Flood Risk Analysis
Realtor.com analyzed residential sales in 41 states from 2016Q1-2022Q2. Luxury homes, defined as those with a sale price in the top 10% of a county in that quarter, were excluded from this analysis, to control for the sometimes very different real estate market trends for these types of homes. Properties were then categorized according to their Flood Factor Rating, and the scores were consolidated into ‘low risk’ and ‘high risk’ categories. Counties with too few sales within a given category and a given quarter were also excluded from the analysis, with 271 counties remaining.
Fire Risk Price Growth
Realtor.com analyzed residential sales in 18 states from 2016Q1-2022Q2. Luxury homes, defined as those with a sale price in the top 10% of a county in that quarter, were excluded from this analysis, to control for the sometimes very different real estate market trends for these types of homes. Properties were then categorized according to their Fire Factor Rating, and the scores were consolidated into ‘low risk’ and ‘high risk’ categories. Counties with too few sales within a given category and a given quarter were also excluded from the analysis, with 97 counties remaining.
Footnotes
- In 2021, the number of flood-related disasters declared at federal level is 7 times in Q1, 8 times in Q2, 25 times in Q3 and 7 times in Q4. We count a declaration as flood-related if the incident type is hurricanes, coastal storms, severe storms or inland floods. Data source:
- We define flood-related disasters as any climate event that can cause floods, including hurricanes, coastal storms, severe storms and inland floods. Counties from Connecticut, Delaware, Florida, Georgia, Maryland, Massachusetts, New Hampshire, New Jersey, New York, North Carolina, South Carolina, Virginia and Washington DC are included in our analysis in Figure 3.
- In 2021, the number of flood-related disasters declared at federal level is 7 times in Q1, 8 times in Q2, 25 times in Q3 and 7 times in Q4. We count a declaration as flood-related if the incident type is hurricanes, coastal storms, severe storms or inland floods. Data source:
- Data source: NOAA National Centers for Environmental Information (NCEI) U.S. Billion-Dollar Weather and Climate Disasters (2022). , DOI: We calculate the damage using the minimum costs as a bottom-line estimation
- In 2021, the number of fires declared at federal level is 3 times in Q1, 10 times in Q2, 27 times in Q3 and 8 times in Q4. Data source: ��
- Our count is sourced from Data source: