
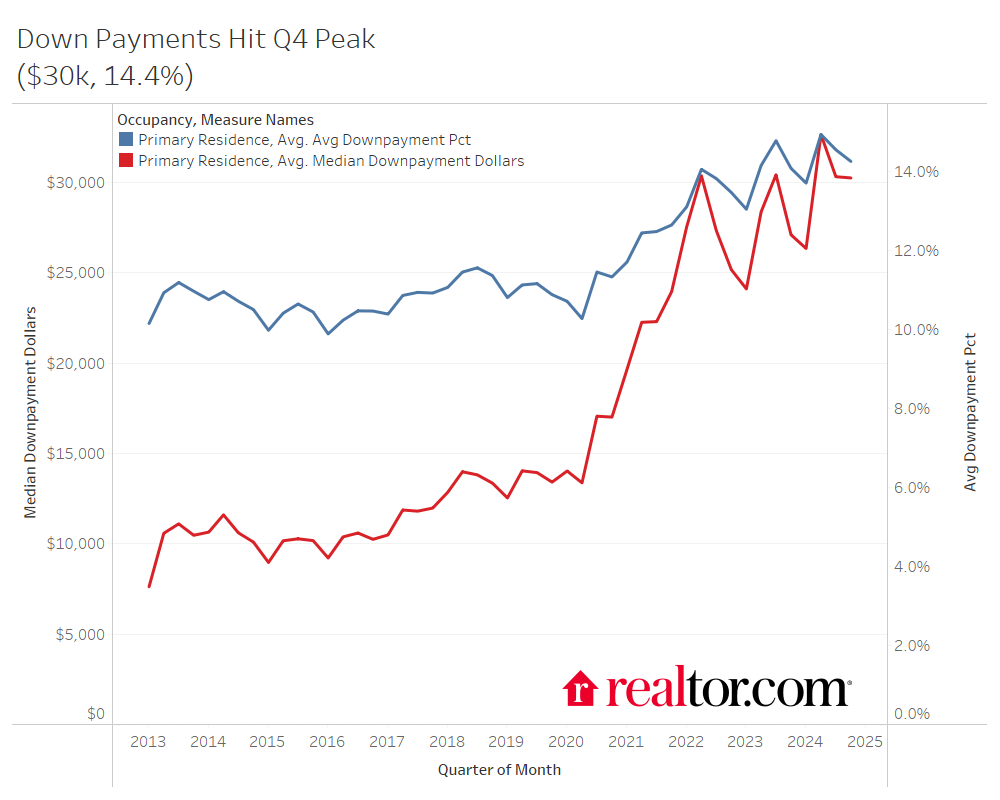
Down payments reached 14.4% and $30,250 nationally in Q4 2024, setting a new Q4 high. As a whole, 2024 saw the highest down payments in the data鈥檚 history, as both a dollar amount and a share of purchase price. Down payments trended sharply higher starting in 2020 due to intense buyer competition and rapid price growth.
Elevated home prices and still-high mortgage rates have pushed down payments even higher by pushing many would-be low down payments out of the market. Put differently, today鈥檚 market is more navigable for high-earning, financially prepared buyers who can afford higher-priced homes and bigger down payments, pushing overall down payments higher.
These trends vary greatly geographically. The in-demand Northeast and Midwest see continued down payment growth, while many markets in the South see falling down payments.听
States with climbing down payments
The states where down payments have grown the most are almost all in the Northeast or the Midwest. Nevada is the only state on the top 10 list that is not in the Midwest or the Northeast. Delaware saw down payments grow 38.6% annually in 2024, reaching roughly $49,000. Overall, the top 10 states by down payment dollar growth saw buyers put between 21.5% and 28.6% more down in 2024 compared with 2023.
| State Name | 2024 Avg Down Payment Share | YoY | 2024 Median Down Payment Dollars | YoY | 2024 Median Sales Price YoY |
| Delaware | 18.5% | 2.4% | $49,219 | 38.6% | 2.0% |
| Rhode Island | 17.4% | 1.1% | $57,952 | 32.8% | 10.5% |
| Maine | 17.3% | 1.9% | $42,185 | 32.0% | 6.9% |
| Nevada | 14.7% | 0.4% | $39,673 | 27.9% | 4.4% |
| Ohio | 12.5% | 0.8% | $17,474 | 27.9% | 8.3% |
| Kansas | 13.1% | 1.1% | $19,528 | 26.9% | -1.6% |
| Wisconsin | 15.5% | 1.0% | $33,230 | 24.0% | 9.1% |
| Connecticut | 16.8% | 0.8% | $51,369 | 24.0% | 9.8% |
| New Jersey | 19.0% | 1.2% | $80,105 | 23.8% | 9.8% |
| New Hampshire | 20.7% | 1.4% | $76,055 | 21.5% | 9.2% |
The Midwest and Northeast continue to see intense buyer demand and limited inventory, which has driven prices higher and led to more competitive market conditions. The Northeast and Midwest both suffer from relatively severe housing supply gaps due to low construction relative to buyer demand. The supply gap improved only slightly in the Midwest in 2024, but continued to grow in the Northeast. Climbing prices and competitive housing conditions are likely to continue in these regions until housing supply and housing affordability improves.
States with falling down payments
Many of the states where down payments have fallen are in the South and West. Other states that boomed during the pandemic, such as Montana, Wyoming, Tennessee, and North Carolina, have experienced a similar softening. Only eight of the 50 states saw down payments fall in 2024.听
| State Name | 2024 Avg Down Payment Share | YoY | 2024 Median Down Payment Dollars | YoY | 2024 Median Sales Price YoY |
| Texas | 11.3% | -0.6% | $15,350 | -16.5% | 0.0% |
| Florida | 14.2% | -1.0% | $27,566 | -14.1% | 0.8% |
| South Dakota | 15.4% | 0.2% | $28,312 | -13.0% | N/A |
| Montana | 18.7% | -1.4% | $60,703 | -8.1% | 4.6% |
| District of Columbia | 19.7% | -1.9% | $93,559 | -7.5% | 3.5% |
| Wyoming | 14.7% | -0.9% | $25,855 | -3.4% | 2.0% |
| Tennessee | 13.7% | -0.5% | $23,326 | -2.0% | 3.8% |
| North Carolina | 14.2% | 0.1% | $27,646 | -0.2% | 3.7% |
Texas and Florida top the list, with down payments falling 16.5% and 14.1% annually in 2024, respectively. These two states experienced a pandemic-era boom that drove prices higher, and have now experienced falling buyer demand and building inventory. Cooling market conditions resulted in stagnant home price growth and falling down payments in 2024.听
Metros with climbing down payments
As a dollar amount, the San Diego metro saw the biggest increase in down payments annually in 2024, followed by Cincinnati, New Orleans, Philadelphia, and Akron. Home prices climbed in almost all of these metros, accounting for some of the increase in down payment amount. San Diego saw falling down payments in 2023, which contributed to the considerable annual uptick in 2024.听
San Diego saw the highest down payment on the list, at more than $150,000, followed by Philadelphia, New Haven, and Las Vegas. Otherwise, buyers in the metros where down payments climbed the most put down less than the national median. Lower down payments allow for more dramatic growth, which is one explanation for the number of affordable markets on the list. Also, affordable markets have surged in popularity in today鈥檚 challenging housing market, resulting in home price growth and increased competition, both of which drive down payments higher.
听
Metros With the Highest Change in Down Payment ($) Q4 2024
| Cbsa Title | 2024 Avg Down Payment % | YoY (percentage pts) | 2024 Median Down Payment $ | % chg YoY听 | Sales Price YoY |
| San Diego-Carlsbad, CA | 21.2% | 2.0% | $150,407 | 33.7% | 7.2% |
| Cincinnati, OH-KY-IN | 13.6% | 1.3% | $23,517 | 32.8% | 9.4% |
| New Orleans-Metairie, LA | 11.4% | 1.1% | $14,658 | 32.7% | 3.5% |
| Philadelphia et al, PA-NJ-DE-MD | 16.6% | 1.6% | $52,406 | 32.3% | 5.2% |
| Akron, OH | 12.9% | 1.3% | $17,551 | 32.1% | 6.5% |
| Las Vegas-Henderson-Paradise, NV | 13.9% | 0.4% | $37,525 | 31.9% | 3.1% |
| Cleveland, OH | 13.2% | 1.4% | $18,743 | 30.9% | 7.7% |
| Jackson, MS | 10.5% | 0.5% | $9,943 | 30.4% | 3.4% |
| Birmingham-Hoover, AL | 12.2% | 1.8% | $15,059 | 29.8% | -0.4% |
| New Haven-Milford, CT | 16.0% | 0.4% | $46,988 | 29.2% | 9.0% |
| Little Rock et al, AR | 10.7% | 0.1% | $11,772 | 27.3% | 5.6% |
Metros with falling down payments
Almost all of the markets where down payments have fallen the most are in Florida or Texas. Tucson, AZ, and Memphis, TN, are the only metros represented that are not in Texas or Florida. This metro-level trend aligns with the state-level trends, which show down payments falling in the South. Cape Coral topped the list with a 31.2% decline in down payments in 2024. Buyers in these metros put down between 9.1% and 31.2% less than the previous year in 2024. The decline is due in part to stagnant or falling home prices. Buyers spent less in more than half of these markets in 2024 compared with the previous year. Generally, these markets saw significant demand during the pandemic, but have since cooled off. Growing inventory and falling competition among buyers relieved upward pressure on down payments.
Only 21 of the 100 largest U.S. metros saw falling down payments in 2024. This small share speaks to the still-competitive conditions and still-climbing sale prices in much of the country.听
| Cbsa Title | 2024 Avg Down Payment % | YoY (percentage pts) | 2024 Median Down Payment $ | % chg YoY听 | Sales Price YoY |
| Cape Coral-Fort Myers, FL | 13.3% | -2.7% | $21,328 | -31.2% | -1.2% |
| Jacksonville, FL | 13.0% | -1.6% | $20,892 | -27.8% | 1.5% |
| Deltona-Daytona Beach et al, FL | 15.6% | -1.0% | $25,816 | -17.4% | 0.0% |
| Palm Bay-Melbourne et al, FL | 13.6% | -1.0% | $21,137 | -17.3% | -0.7% |
| Tucson, AZ | 13.5% | -0.8% | $21,834 | -15.5% | 1.7% |
| Memphis, TN-MS-AR | 9.6% | -0.9% | $8,251 | -15.4% | -2.4% |
| Austin-Round Rock, TX | 14.7% | -0.9% | $44,817 | -13.0% | -2.6% |
| San Antonio-New Braunfels, TX | 7.4% | -0.9% | $5,388 | -10.8% | -2.2% |
| Tampa-St. Petersburg et al, FL | 14.0% | -0.9% | $30,961 | -9.7% | 1.3% |
| Lakeland-Winter Haven, FL | 8.0% | -1.2% | $6,489 | -9.1% | -2.1% |
Moving forward
Down payments are expected to remain elevated in the near term as home prices and mortgage rates remain high. Entry-level buyers will continue to find it challenging to afford a home purchase, leading to more repeat buyers in the market, which will bias down payments higher. However, markets in the South and West that see ample inventory and falling demand may continue to see softening down payments, especially compared with still-competitive markets in the Northeast and Midwest.听
State-Level Down Payments 2024
| State Name | 2024 Avg Down Payment Share | YoY | 2024 Median Down Payment Dollars | YoY | 2024 Median Sales Price YoY |
| Alabama | 10.6% | 0.5% | 8,207 | 4.7% | -0.3% |
| Alaska | 11.0% | -0.2% | 20,972 | 14.8% | 3.3% |
| Arizona | 14.6% | 0.0% | 32,839 | 8.1% | 1.1% |
| Arkansas | 11.7% | 0.5% | 12,532 | 18.7% | 7.3% |
| California | 18.6% | 0.5% | 93,633 | 18.4% | 6.8% |
| Colorado | 17.5% | 0.1% | 73,415 | 11.0% | 1.8% |
| Connecticut | 16.8% | 0.8% | 51,369 | 24.0% | 9.8% |
| Delaware | 18.5% | 2.4% | 49,219 | 38.6% | 2.0% |
| District of Columbia | 19.7% | -1.9% | 93,559 | -7.5% | 3.5% |
| Florida | 14.2% | -1.0% | 27,566 | -14.1% | 0.8% |
| Georgia | 12.0% | 0.2% | 16,724 | 7.5% | 4.7% |
| Hawaii* | 18.0% | 2.7% | 93,928 | 69.1%* | -6.8% |
| Idaho | 19.2% | -0.4% | 56,166 | 1.7% | 1.6% |
| Illinois | 14.4% | 0.6% | 30,561 | 15.7% | 7.7% |
| Indiana | 13.0% | 0.6% | 17,934 | 12.3% | -0.3% |
| Iowa | 16.1% | 0.6% | 28,721 | 14.3% | 7.3% |
| Kansas | 13.1% | 1.1% | 19,528 | 26.9% | -1.6% |
| Kentucky | 13.0% | 0.4% | 17,390 | 15.9% | 8.7% |
| Louisiana | 9.3% | 0.4% | 6,582 | 3.1% | 2.4% |
| Maine | 17.3% | 1.9% | 42,185 | 32.0% | 6.9% |
| Maryland | 12.5% | 0.4% | 25,309 | 9.2% | 5.4% |
| Massachusetts | 18.6% | -0.1% | 76,969 | 1.6% | 10.3% |
| Michigan | 14.0% | 0.4% | 22,610 | 15.5% | 9.9% |
| Minnesota | 15.7% | 0.5% | 38,231 | 7.8% | 4.8% |
| Mississippi | 8.8% | -0.1% | 6,191 | 6.5% | 11.6% |
| Missouri | 12.9% | 0.6% | 18,176 | 20.4% | 4.3% |
| Montana | 18.7% | -1.4% | 60,703 | -8.1% | 4.6% |
| Nebraska | 14.8% | 0.3% | 26,651 | 11.7% | 9.6% |
| Nevada | 14.7% | 0.4% | 39,673 | 27.9% | 4.4% |
| New Hampshire | 20.7% | 1.4% | 76,055 | 21.5% | 9.2% |
| New Jersey | 19.0% | 1.2% | 80,105 | 23.8% | 9.8% |
| New Mexico | 12.5% | 0.5% | 17,938 | 5.8% | 20.0% |
| New York | 17.5% | 0.6% | 54,682 | 16.0% | 7.5% |
| North Carolina | 14.2% | 0.1% | 27,646 | -0.2% | 3.7% |
| North Dakota | 14.8% | 1.1% | 25,292 | 13.5% | 8.9% |
| Ohio | 12.5% | 0.8% | 17,474 | 27.9% | 8.3% |
| Oklahoma | 11.9% | 0.1% | 13,327 | 2.1% | 5.6% |
| Oregon | 16.9% | 0.0% | 55,397 | 9.0% | 3.0% |
| Pennsylvania | 14.7% | 1.0% | 27,991 | 20.4% | 6.2% |
| Rhode Island | 17.4% | 1.1% | 57,952 | 32.8% | 10.5% |
| South Carolina | 14.6% | 0.4% | 21,179 | 2.1% | 1.5% |
| South Dakota | 15.4% | 0.2% | 28,312 | -13.0% | #N/A |
| Tennessee | 13.7% | -0.5% | 23,326 | -2.0% | 3.8% |
| Texas | 11.3% | -0.6% | 15,350 | -16.5% | 0.0% |
| Utah | 16.0% | 0.7% | 45,562 | 12.6% | 0.2% |
| Vermont | 17.8% | 0.1% | 51,411 | 20.7% | 7.4% |
| Virginia | 13.8% | 0.6% | 30,810 | 15.2% | 4.8% |
| Washington | 18.1% | 1.0% | 85,362 | 19.9% | 8.2% |
| West Virginia | 9.7% | 0.7% | 7,412 | 15.2% | 15.9% |
| Wisconsin | 15.5% | 1.0% | 33,230 | 24.0% | 9.1% |
| Wyoming | 14.7% | -0.9% | 25,855 | -3.4% | 2.0% |
* Hawaii may have a quality issue, so it has been excluded from the ranking.听
Methodology
Down payment trends were analyzed at the national and top 100 metro levels through Q4 of 2024 using Optimal Blue data. Down payment as a share of the sale price is calculated as an average across the data. Down payment as a dollar amount is calculated by taking the median across the data. All comparisons are between 2023 and 2024 unless otherwise stated.听