
- Pending home sales- homes under contract- fell 5.2% in major metro areas, as still-high mortgage rates and financial uncertainty weighed on buyers.
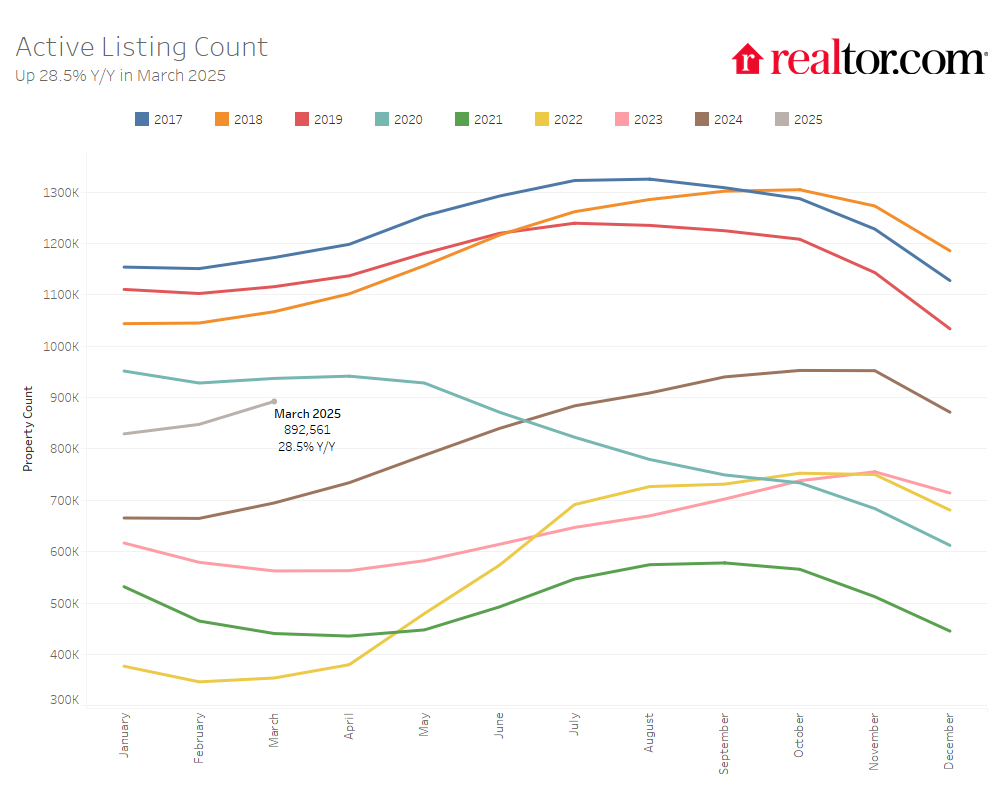
- The inventory of homes for sale rose 28.5% year-over-year, marking the 17th consecutive month of inventory growth.
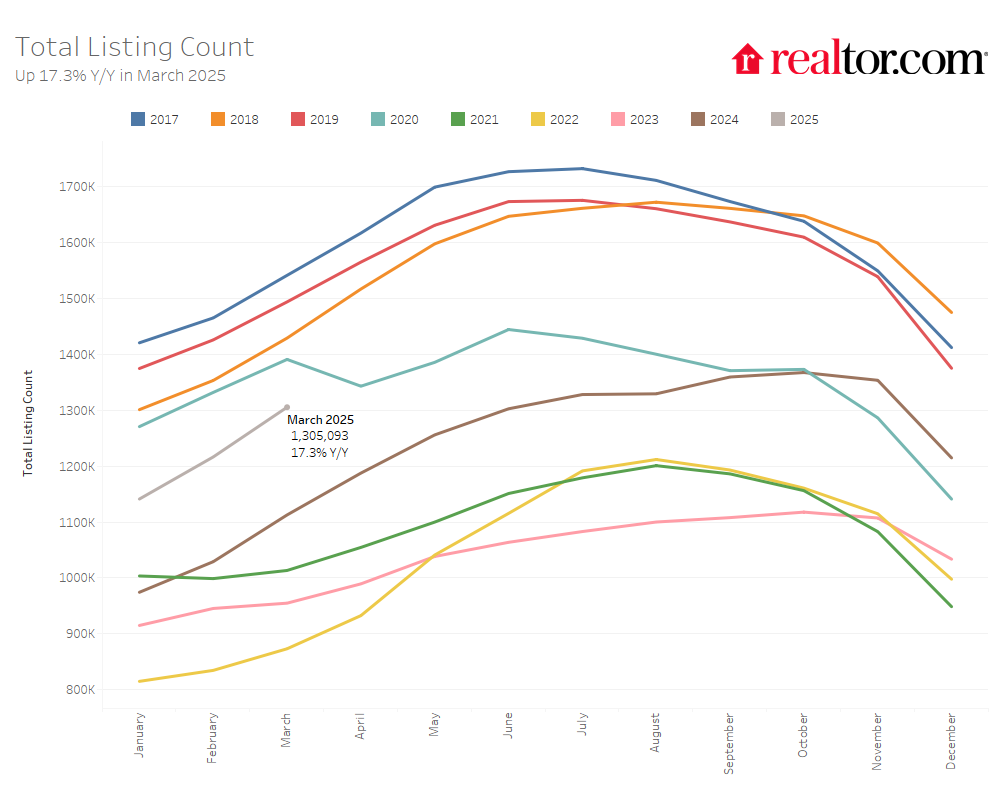
- The total number of unsold homes, including those under contract, was up 17.3% compared to last year.
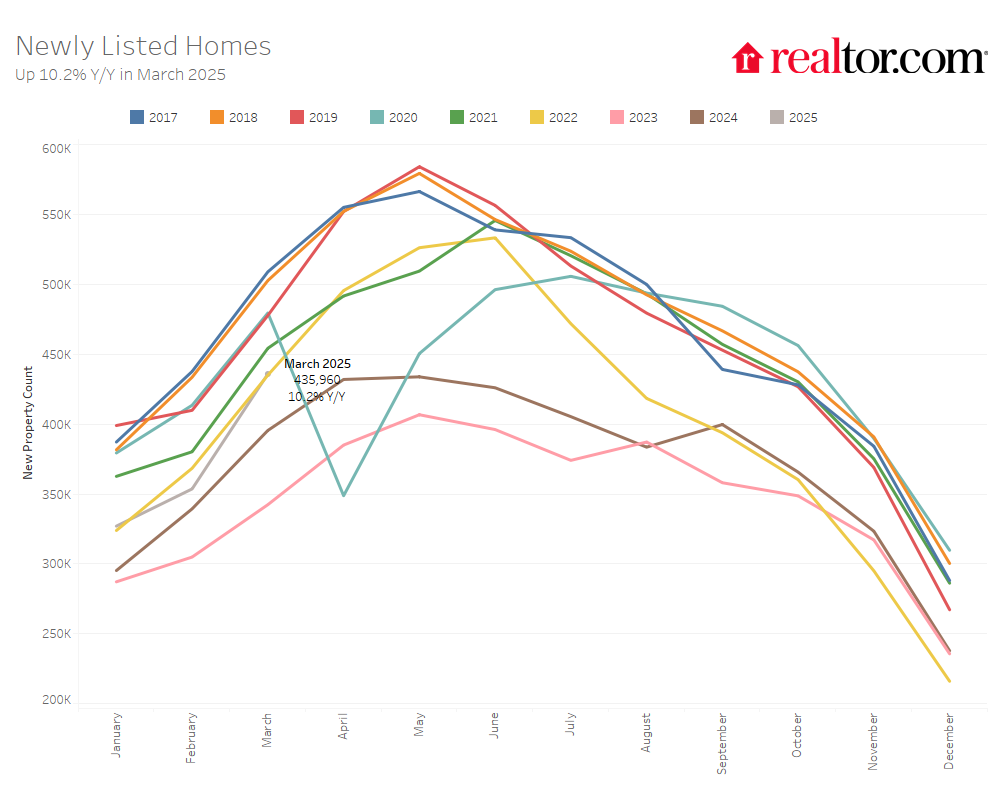
- New home listings increased 10.2% from a year ago, the highest March level in three years.
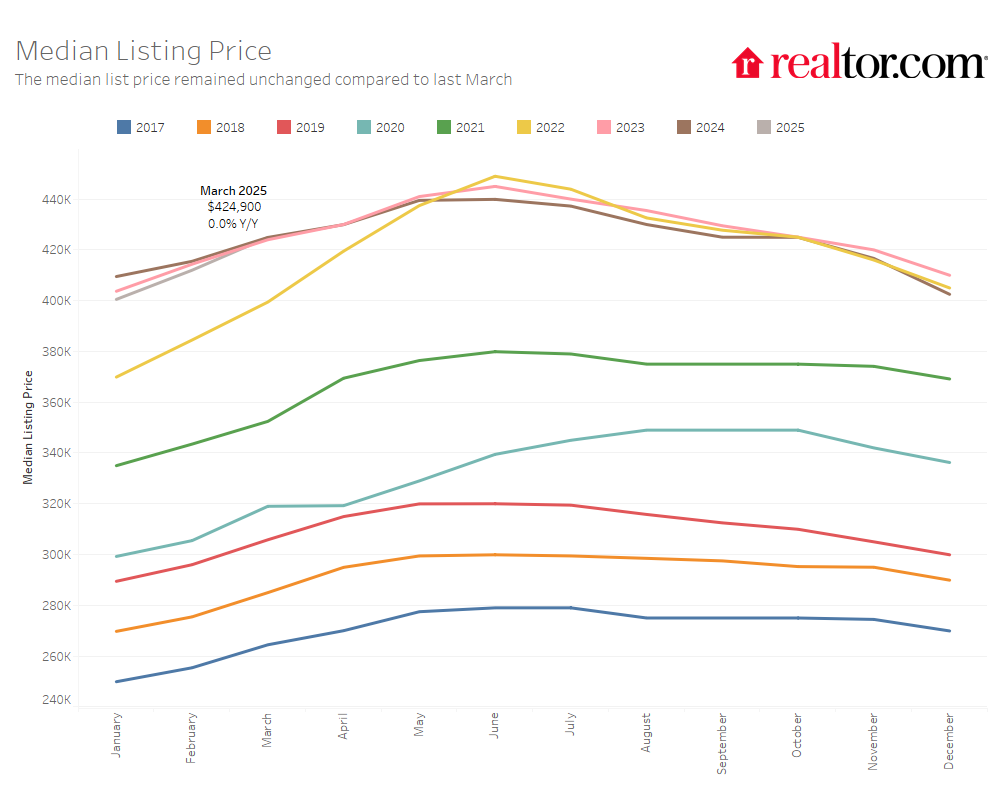
- The national median list price for homes was $424,900, unchanged from last year, while the price per square foot rose 1.3%, signaling modest home value growth.
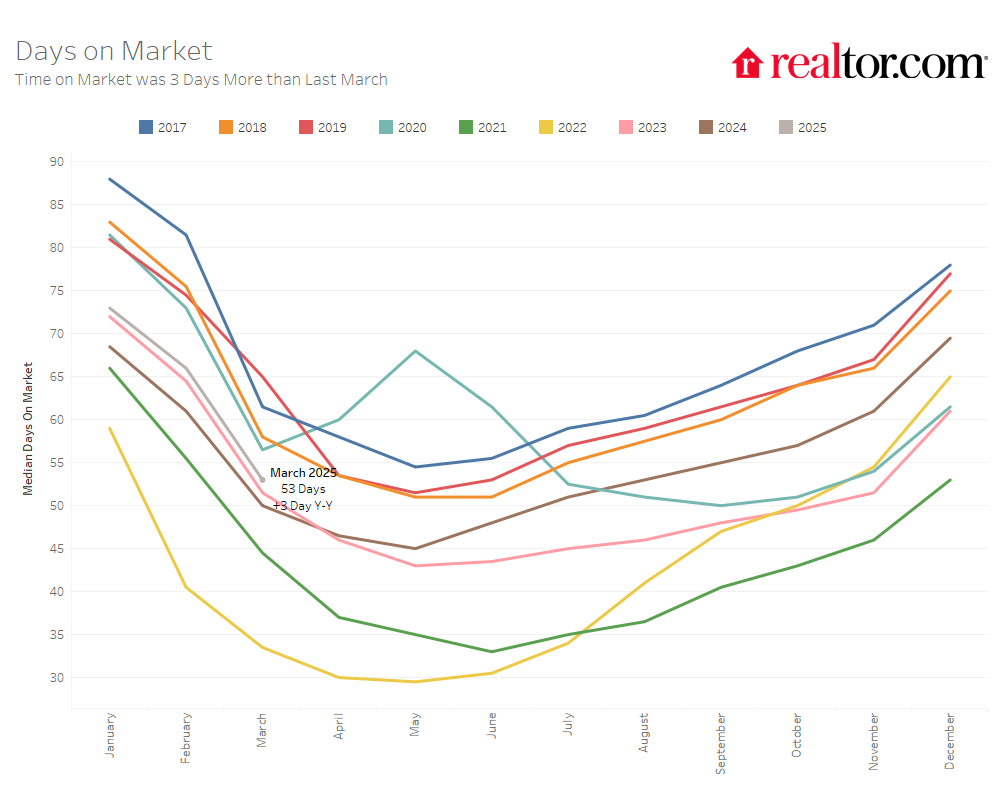
- Homes spent a median of 53 days on the market, three more than a year ago.
- 17.5% of listings saw price reductions, the highest share for any March since at least 2016.
According to the Realtor.com® March housing data, the U.S. housing market continued to loosen up in March, giving buyers more options as inventory grew for the 17th month in a row. Sellers are gradually returning to the market, with new listings hitting their highest March level in three years—even as mortgage rates remain elevated. Still, home shoppers are treading carefully: fewer homes went under contract compared to last year in the nation’s largest metro areas, and homes are spending more time on the market than they did a year ago. Prices are holding steady overall, but more sellers are trimming their asking prices, a sign that expectations are adjusting to meet what buyers can afford. As the spring season picks up, the market appears to be rebalancing—offering more supply, but with buyer demand showing signs of caution.
Pending Home Sales Dip as Rates and Uncertainty Weigh on Buyers
The number of homes under contract but not yet sold (pending listings) dipped in March, reversing some momentum seen earlier in the year. Compared to last March, pending home listings in large metropolitan areas are down 5.2%. This softer activity may be linked to mortgage rates, which were higher in January and February than they were at the end of last year. Additionally, affordability concerns persist as the metro areas which have seen affordability erode most compared to pre-pandemic levels are generally also seeing pending home sales decline most this spring.
Consumer sentiment has also taken a hit. According to , more people expressed concerns about rising mortgage rates and their personal finances in February. It marked the first decline in overall housing sentiment in over a year. Ongoing uncertainty about the broader economy- amid numerous discussions of possible policy changes- could also be giving some buyers pause as they weigh their options.
This softening was seen in many major metro areas as well, with 36 of 44 analyzed metros recording a year-over-year drop in pending home sales. Jacksonville (-15.1%), Virginia Beach (-14.2%), Miami (-13.7%), and Memphis (-13.0%) were among those seeing the most notable slowdowns compared with last year. Jacksonville, Miami, and other Florida metro areas are reflecting a cooling in the Florida market, and Memphis and Virginia Beach topped the list of metros which saw affordability erode most since 2019.

Californian metros are the surprising outliers of this general trend– with San Jose (+6.4%), Sacramento (+4.6%), San Francisco (+2.6%), and Los Angeles (+1.2%) all seeing pending listings increase over the previous year. The only other four metro areas seeing an increase were Grand Rapids (+6.1%), Kansas City (+3.4%), Buffalo (+2.5%), and St. Louis (+0.2%). Out of the largest 50 metro areas, San Francisco and San Jose were the only two that have had improvements in their affordability scores since 2019, as local incomes kept up with very modest price gains over the past several years.
March Sees More Home Listings, But Market Not Fully Restocked
Buyers had more homes to choose from this March, with the number of homes actively for sale up 28.5% compared to the same time last year. That marks the 17th month in a row of year-over-year inventory growth and a slight improvement over February’s gain of 27.5%. Still, even with this progress, housing inventory remains 20.2% below typical levels seen between 2017 and 2019, showing that the market still has catching up to do.
Total home listing inventory- including both homes for sale and under contract- rose by 17.3% compared with last year, growing on an annual basis for the 16th month in a row. However, this is a small dip from the previous month’s 18.2% gain, due to a slowdown in pending home listings.
There was some positive news for inventory: newly listed homes rose 10.2% year-over-year in March, up from February’s 5.1% gain. That makes it the most active March for new listings in three years. While mortgage rates are still elevated, it’s possible that some homeowners are deciding they can’t wait any longer, choosing to list now rather than hold out for a major drop in mortgage rates.
Where Housing Inventory Is Growing the Fastest
All four major U.S. regions posted inventory growth in March, but the pace differed sharply:
- West: +40.3%
- South: +31.1%
- Midwest: +17.7%
- Northeast: +11.3%
Compared to typical pre-pandemic March levels (2017–2019), inventory is nearly back to normal in the West and South, down just 2.1% and 3.2%, respectively. But in the Midwest and Northeast, there’s still a long way to go—inventory is down 45.2% and 57.5%, respectively.
At the metro level, all 50 of the largest markets saw inventory rise year-over-year. Some of the biggest gains came from:
- San Jose (+67.9%)
- Las Vegas (+67.8%)
- Denver (+67.3%)
Even so, most metros still have fewer homes available than they did pre-pandemic. That said, 18 markets have now surpassed their 2017–2019 inventory levels, up from just 15 last month. Top standouts include:
- Denver (+75.0%)
- San Antonio (+49.6%)
- Dallas (+44.9%)
Home Sellers Return, Boosting New Listings in Most Metro Areas
The inventory of newly listed homes increased across all four regions, led by:
- West: +14.0%
- South: +10.9%
- Midwest: +7.3%
- Northeast: +6.4%
When compared to pre-pandemic norms, the South is the closest to recovery—down just 3.2%. In contrast, the Northeast lags furthest behind, with new listings still down 30.2% from typical March levels, consistent with supply gap research showing the biggest construction shortfall and no progress toward closing it in the Northeast.
Across the 50 largest metro areas, 47 saw an increase in new listings this March, up from 35 last month. But only 10 metros had more newly listed homes than they typically saw in March 2017–2019. These included Austin, San Antonio, and Dallas.
Biggest year-over-year gains in new listings were seen in:
- Denver (+33.3%)
- San Jose (+32.8%)
- Richmond (+27.5%)
Home Listings Linger Slightly Longer Than Last Year
In March, the typical home for sale spent 53 days on the market—three days longer than the same time last year. This marks the 12th consecutive month where homes have taken longer to sell compared to the year before. However, homes are still moving faster than they did before the pandemic, with days on market nine days shorter than the March 2017–2019 average.
Regional and Metro Time on Market Trends: Up from Last Year, Still Faster Than Pre-COVID
Time on market rose in all four regions compared to last year:
- South: +5 days
- Midwest: +4 days
- West: +2 days
- Northeast: +1 day
Still, in every region, homes are selling faster than they did pre-pandemic. Compared to the 2017–2019 average:
- West: 1 day faster
- South: 5 days faster
- Midwest: 13 days faster
- Northeast: 19 days faster
Across the 50 largest metros, 36 saw homes sit longer than last year. The biggest jumps were in:
- Nashville (+15 days)
- Buffalo (+11 days)
- Jacksonville (+10 days)
A handful of markets, including Portland, Denver and Nashville, are seeing home listings spend more time on the market than their pre-pandemic norms.
Home Prices Hold Steady, But Sellers Are Cutting More Often
The national median list price of homes for sale in March was $424,900, unchanged from a year ago (+0.0%). However, when accounting for the shift toward smaller homes on the market, prices are still edging up. The price per square foot rose 1.3% year-over-year. Since March 2019, the typical list price has climbed nearly 39%, while price per square foot is up nearly 55%.
But while asking prices are holding firm, more sellers are adjusting. In March, 17.5% of homes had price reductions—2.5 percentage points higher than last year and the highest share for any March in Realtor.com’s data since at least 2016. This trend suggests that sellers are becoming more responsive to shifting demand and affordability limits.

Regional and Metro Area Price Trends
Year-over-year median list price changes by region:
- Northeast: +0.9%
- West: +0.0%
- South: -0.6%
- Midwest: -1.6%
However, looking at price per square foot (which adjusts for changing home sizes), all regions except the South saw gains:
- Northeast: +4.3%
- Midwest: +1.1%
- West: +1.0%
- South: +0.0%
Among large metros, the biggest annual price increases were:
- Baltimore (+11.9%)
- Providence (+10.0%)
- Hartford (9.9%)
Compared to March 2019, every large metro has seen price growth. The biggest gains since pre-pandemic times include:
- Memphis (+56.8%)
- Los Angeles (+53.0%)
- Boston (+52.1%)
The smallest long-term price gains were in:
- San Francisco (+3.6%)
- Detroit (+5.2%)
- Chicago (+9.9%)
In general, markets where buyer demand is slowing- such as having fewer homes under contract or more homes for sale than a year ago- tend to see more price drops. Metros with the highest share included:
- Phoenix (32.6% of listings)
- Tampa (28.9%)
- Jacksonville (27.7%)

March 2025 Regional Statistics
| Region | Active Listing Count YoY | New Listing Count YoY | Median Listing Price YoY | Median Listing Price Per SF YoY | Median Days on Market Y-Y (Days) | Price-Reduced Share Y-Y (Percentage Points) |
| Midwest | 17.7% | 7.3% | -1.6% | 1.1% | 4 | +1.7 pp |
| Northeast | 11.3% | 6.4% | 0.9% | 4.3% | 1 | +0.8 pp |
| South | 31.1% | 10.9% | -0.6% | 0.0% | 5 | +2.1 pp |
| West | 40.3% | 14.0% | 0.0% | 1.0% | 2 | +4.5 pp |
March 2025 Housing Overview of the 50 Largest Metros
| Metro Area | Pending Listing Inventory YoY | Median Listing Price | Median Listing Price YoY | Median Listing Price per Sq. Ft. YoY | Median Listing Price vs March 2019 | Median Listing Price per Sq. Ft. vs March 2019 |
| Atlanta-Sandy Springs-Roswell, Ga. | -9.7% | $400,000 | -2.4% | -1.4% | 23.9% | 54.2% |
| Austin-Round Rock-San Marcos, Texas | N/A | $510,000 | -7.2% | -4.4% | 42.2% | 57.0% |
| Baltimore-Columbia-Towson, Md. | -4.4% | $374,900 | 11.9% | 3.6% | 19.9% | 29.1% |
| Birmingham, Ala. | -0.6% | $285,000 | -1.7% | 0.4% | 16.7% | 31.7% |
| Boston-Cambridge-Newton, Mass.-N.H. | N/A | $869,000 | -1.2% | 2.0% | 52.1% | 75.3% |
| Buffalo-Cheektowaga, N.Y. | 2.5% | $260,000 | -3.7% | 1.7% | 32.9% | 51.0% |
| Charlotte-Concord-Gastonia, N.C.-S.C. | -5.5% | $425,000 | 3.4% | 0.6% | 24.5% | 59.9% |
| Chicago-Naperville-Elgin, Ill.-Ind. | -1.9% | $360,000 | -4.0% | -1.0% | 9.9% | 29.3% |
| Cincinnati, Ohio-Ky.-Ind. | -3.1% | $335,000 | -4.5% | 2.3% | 25.0% | 54.8% |
| Cleveland, Ohio | -5.8% | $249,000 | 8.7% | 8.9% | 30.1% | 56.6% |
| Columbus, Ohio | N/A | $360,000 | -5.2% | 1.1% | 26.0% | 59.0% |
| Dallas-Fort Worth-Arlington, Texas | -5.1% | $423,503 | -3.7% | -0.6% | 19.7% | 42.9% |
| Denver-Aurora-Centennial, Colo. | -1.5% | $585,000 | -5.6% | -2.4% | 13.5% | 43.7% |
| Detroit-Warren-Dearborn, Mich. | -7.3% | $245,000 | 2.1% | 2.8% | 5.2% | 25.0% |
| Grand Rapids-Wyoming-Kentwood, Mich. | 6.1% | $385,000 | -7.2% | -0.5% | 36.1% | 52.6% |
| Hartford-West Hartford-East Hartford, Conn. | -7.7% | $449,900 | 9.9% | 11.2% | 51.6% | 61.4% |
| Houston-Pasadena-The Woodlands, Texas | -2.7% | $365,000 | 1.2% | -0.4% | 15.3% | 37.5% |
| Indianapolis-Carmel-Greenwood, Ind. | -0.5% | $315,000 | -4.5% | 0.1% | 17.0% | 51.9% |
| Jacksonville, Fla. | -15.1% | $399,000 | -3.9% | -2.6% | 30.8% | 51.2% |
| Kansas City, Mo.-Kan. | 3.4% | $395,500 | -6.9% | 0.6% | 23.6% | 45.6% |
| Las Vegas-Henderson-North Las Vegas, Nev. | -5.6% | $469,945 | 0.0% | 2.2% | 50.3% | 57.5% |
| Los Angeles-Long Beach-Anaheim, Calif. | 1.2% | $1,179,000 | 2.5% | 1.9% | 53.0% | 54.9% |
| Louisville/Jefferson County, Ky.-Ind. | -5.0% | $320,000 | 1.6% | 1.7% | 18.6% | 44.4% |
| Memphis, Tenn.-Miss.-Ark. | -13.0% | $334,000 | 2.5% | 2.3% | 56.8% | 68.9% |
| Miami-Fort Lauderdale-West Palm Beach, Fla. | -13.7% | $512,000 | -6.7% | -4.5% | 30.0% | 47.2% |
| Milwaukee-Waukesha, Wis. | -7.5% | $375,000 | 2.8% | 5.5% | 38.4% | 52.3% |
| Minneapolis-St. Paul-Bloomington, Minn.-Wis. | -3.6% | $445,900 | 0.2% | -0.3% | 16.5% | 30.3% |
| Nashville-Davidson-Murfreesboro-Franklin, Tenn. | N/A | $535,000 | -3.7% | -0.9% | 46.9% | 63.4% |
| New York-Newark-Jersey City, N.Y.-N.J. | N/A | $780,000 | 1.3% | -3.2% | 38.7% | 78.3% |
| Oklahoma City, Okla. | -3.0% | $317,950 | -1.2% | 1.6% | 30.1% | 45.8% |
| Orlando-Kissimmee-Sanford, Fla. | -9.5% | $419,800 | -4.4% | -2.3% | 36.5% | 53.6% |
| Philadelphia-Camden-Wilmington, Pa.-N.J.-Del.-Md. | -6.1% | $359,000 | 2.6% | 2.6% | 36.2% | 57.3% |
| Phoenix-Mesa-Chandler, Ariz. | N/A | $520,000 | -2.8% | -1.3% | 43.9% | 57.0% |
| Pittsburgh, Pa. | -6.4% | $239,000 | 1.8% | 3.7% | 35.9% | 40.2% |
| Portland-Vancouver-Hillsboro, Ore.-Wash. | -6.1% | $599,900 | -0.8% | -0.5% | 24.8% | 39.4% |
| Providence-Warwick, R.I.-Mass. | -10.3% | $549,900 | 10.0% | 6.1% | 50.1% | 50.5% |
| Raleigh-Cary, N.C. | -9.3% | $445,000 | -1.1% | -0.1% | 22.3% | 54.1% |
| Richmond, Va. | -1.2% | $444,900 | -1.1% | 2.6% | 36.0% | 60.2% |
| Riverside-San Bernardino-Ontario, Calif. | -2.1% | $599,999 | 0.2% | 1.0% | 47.5% | 60.5% |
| Sacramento-Roseville-Folsom, Calif. | 4.6% | $625,000 | -1.6% | -1.4% | 31.2% | 37.8% |
| San Antonio-New Braunfels, Texas | -0.8% | $334,990 | -1.4% | -2.4% | 14.9% | 36.1% |
| San Diego-Chula Vista-Carlsbad, Calif. | -0.1% | $950,000 | -4.8% | -2.0% | 38.7% | 62.2% |
| San Francisco-Oakland-Fremont, Calif. | 2.6% | $950,000 | -4.9% | -6.9% | 3.6% | 21.2% |
| San Jose-Sunnyvale-Santa Clara, Calif. | 6.4% | $1,388,944 | -6.2% | -1.3% | 26.0% | 25.0% |
| Seattle-Tacoma-Bellevue, Wash. | -5.4% | $750,000 | -2.3% | 3.1% | 23.3% | 53.1% |
| St. Louis, Mo.-Ill. | 0.2% | $289,900 | -0.7% | -2.2% | 32.2% | 32.1% |
| Tampa-St. Petersburg-Clearwater, Fla. | -11.6% | $399,900 | -4.6% | -3.0% | 45.8% | 63.4% |
| Tucson, Ariz. | -4.4% | $399,000 | -0.9% | -1.3% | 35.8% | 54.1% |
| Virginia Beach-Chesapeake-Norfolk, Va.-N.C. | -14.2% | $399,966 | 1.3% | 5.0% | 40.6% | 53.9% |
| Washington-Arlington-Alexandria, DC-Va.-Md.-W. Va. | -7.9% | $604,900 | -0.8% | -2.1% | 28.3% | 56.1% |
| Metro Area | Active Listing Count YoY | New Listing Count YoY | Median Days on Market | Median Days on Market Y-Y (Days) | Price– Reduced Share | Price-Reduced Share Y-Y (Percentage Points) |
| Atlanta-Sandy Springs-Roswell, Ga. | 44.3% | 19.8% | 47 | 6 | 20.7% | 5.0 pp |
| Austin-Round Rock-San Marcos, Texas | 22.1% | 10.6% | 44 | 4 | 22.2% | -0.1 pp |
| Baltimore-Columbia-Towson, Md. | 37.8% | 16.1% | 29 | -7 | 13.1% | 1.7 pp |
| Birmingham, Ala. | 18.2% | 3.4% | 54 | 4 | 16.3% | 3.1 pp |
| Boston-Cambridge-Newton, Mass.-N.H. | 18.4% | 6.4% | 25 | 1 | 10.2% | 0.5 pp |
| Buffalo-Cheektowaga, N.Y. | -2.1% | -13.0% | 49 | 11 | 5.4% | 0.1 pp |
| Charlotte-Concord-Gastonia, N.C.-S.C. | 47.4% | 21.5% | 43 | 5 | 21.2% | 4.7 pp |
| Chicago-Naperville-Elgin, Ill.-Ind. | 10.6% | 4.1% | 36 | 2 | 10.7% | 3.0 pp |
| Cincinnati, Ohio-Ky.-Ind. | 27.5% | 4.9% | 37 | 1 | 13.3% | 2.3 pp |
| Cleveland, Ohio | 11.6% | 9.1% | 45 | 3 | 13.0% | 2.0 pp |
| Columbus, Ohio | 38.8% | 13.7% | 37 | 8 | 18.0% | 3.8 pp |
| Dallas-Fort Worth-Arlington, Texas | 38.4% | 18.4% | 45 | 5 | 23.4% | 3.9 pp |
| Denver-Aurora-Centennial, Colo. | 67.3% | 33.3% | 35 | 5 | 24.4% | 7.1 pp |
| Detroit-Warren-Dearborn, Mich. | 9.5% | 6.1% | 42 | 0 | 11.5% | 1.7 pp |
| Grand Rapids-Wyoming-Kentwood, Mich. | 27.4% | 18.5% | 38 | 1 | 10.8% | 1.7 pp |
| Hartford-West Hartford-East Hartford, Conn. | 11.2% | 11.0% | 30 | -8 | 5.5% | 0.4 pp |
| Houston-Pasadena-The Woodlands, Texas | 30.5% | 12.2% | 45 | 2 | 18.1% | 1.4 pp |
| Indianapolis-Carmel-Greenwood, Ind. | 24.7% | 7.1% | 44 | 2 | 19.0% | 2.7 pp |
| Jacksonville, Fla. | 35.6% | 9.8% | 57 | 10 | 27.7% | 5.6 pp |
| Kansas City, Mo.-Kan. | 11.5% | 4.2% | 51 | 0 | 11.1% | -0.1 pp |
| Las Vegas-Henderson-North Las Vegas, Nev. | 67.8% | 14.2% | 44 | 6 | 21.7% | 7.9 pp |
| Los Angeles-Long Beach-Anaheim, Calif. | 51.8% | 19.0% | 42 | 0 | 13.3% | 4.3 pp |
| Louisville/Jefferson County, Ky.-Ind. | 21.4% | 12.3% | 41 | 0 | 15.7% | 2.2 pp |
| Memphis, Tenn.-Miss.-Ark. | 28.1% | -3.4% | 58 | 7 | 20.4% | 1.2 pp |
| Miami-Fort Lauderdale-West Palm Beach, Fla. | 39.8% | 8.3% | 67 | 9 | 21.3% | 1.5 pp |
| Milwaukee-Waukesha, Wis. | 7.7% | -8.0% | 31 | 2 | 9.0% | 1.0 pp |
| Minneapolis-St. Paul-Bloomington, Minn.-Wis. | 10.1% | 12.0% | 33 | -1 | 10.2% | 0.6 pp |
| Nashville-Davidson-Murfreesboro-Franklin, Tenn. | 31.2% | 22.4% | 47 | 15 | 16.8% | -2.0 pp |
| New York-Newark-Jersey City, N.Y.-N.J. | 3.3% | 9.9% | 48 | -2 | 7.0% | 0.2 pp |
| Oklahoma City, Okla. | 34.2% | 8.0% | 47 | 2 | 18.2% | 1.0 pp |
| Orlando-Kissimmee-Sanford, Fla. | 45.8% | 11.5% | 60 | 6 | 24.7% | 4.5 pp |
| Philadelphia-Camden-Wilmington, Pa.-N.J.-Del.-Md. | 18.0% | 10.1% | 39 | -4 | 11.7% | 0.6 pp |
| Phoenix-Mesa-Chandler, Ariz. | 39.3% | 18.2% | 51 | 2 | 32.6% | 9.6 pp |
| Pittsburgh, Pa. | 10.8% | 13.9% | 62 | 6 | 13.8% | 1.1 pp |
| Portland-Vancouver-Hillsboro, Ore.-Wash. | 29.6% | 7.8% | 51 | 6 | 22.7% | 2.6 pp |
| Providence-Warwick, R.I.-Mass. | 25.9% | 10.3% | 36 | 1 | 8.9% | 2.6 pp |
| Raleigh-Cary, N.C. | 47.4% | 14.5% | 44 | 3 | 19.7% | 8.5 pp |
| Richmond, Va. | 22.0% | 27.5% | 44 | 0 | 10.1% | 1.0 pp |
| Riverside-San Bernardino-Ontario, Calif. | 50.2% | 16.3% | 51 | 4 | 17.8% | 4.8 pp |
| Sacramento-Roseville-Folsom, Calif. | 52.1% | 17.0% | 36 | 0 | 16.6% | 5.5 pp |
| San Antonio-New Braunfels, Texas | 17.7% | 16.5% | 60 | 3 | 25.1% | 3.3 pp |
| San Diego-Chula Vista-Carlsbad, Calif. | 66.6% | 14.1% | 36 | 4 | 16.3% | 5.5 pp |
| San Francisco-Oakland-Fremont, Calif. | 43.2% | 15.5% | 31 | 4 | 11.6% | 3.0 pp |
| San Jose-Sunnyvale-Santa Clara, Calif. | 67.9% | 32.8% | 22 | 0 | 8.9% | 3.1 pp |
| Seattle-Tacoma-Bellevue, Wash. | 40.3% | 18.6% | 31 | 2 | 11.2% | 2.5 pp |
| St. Louis, Mo.-Ill. | 18.4% | 15.7% | 39 | 0 | 12.5% | 2.2 pp |
| Tampa-St. Petersburg-Clearwater, Fla. | 28.5% | 3.6% | 57 | 6 | 28.9% | 1.3 pp |
| Tucson, Ariz. | 50.8% | 11.6% | 50 | 6 | 24.2% | 4.6 pp |
| Virginia Beach-Chesapeake-Norfolk, Va.-N.C. | 26.0% | 20.7% | 38 | 4 | 15.1% | 1.9 pp |
| Washington-Arlington-Alexandria, DC-Va.-Md.-W. Va. | 64.0% | 25.5% | 24 | -7 | 12.4% | 3.8 pp |
Methodology
Realtor.com housing data as of March 2025. Listings include the active inventory of existing single-family homes and condos/townhomes/row homes/co-ops for the given level of geography on Realtor.com; new construction is excluded unless listed via an MLS that provides listing data to Realtor.com. Realtor.com data history goes back to July 2016. The 50 largest U.S. metropolitan areas as defined by the Office of Management and Budget (OMB-202301) and Claritas 2025 estimates of household counts. With the release of its January 2025 housing trends report, Realtor.com® has restated data points for some previous months. As a result of these changes, some of the data released since January 2025 will not be directly comparable with previous data releases (files downloaded before January 2025) and Realtor.com® economics research reports.