

�ᾱ�����������ٲ�:��
-
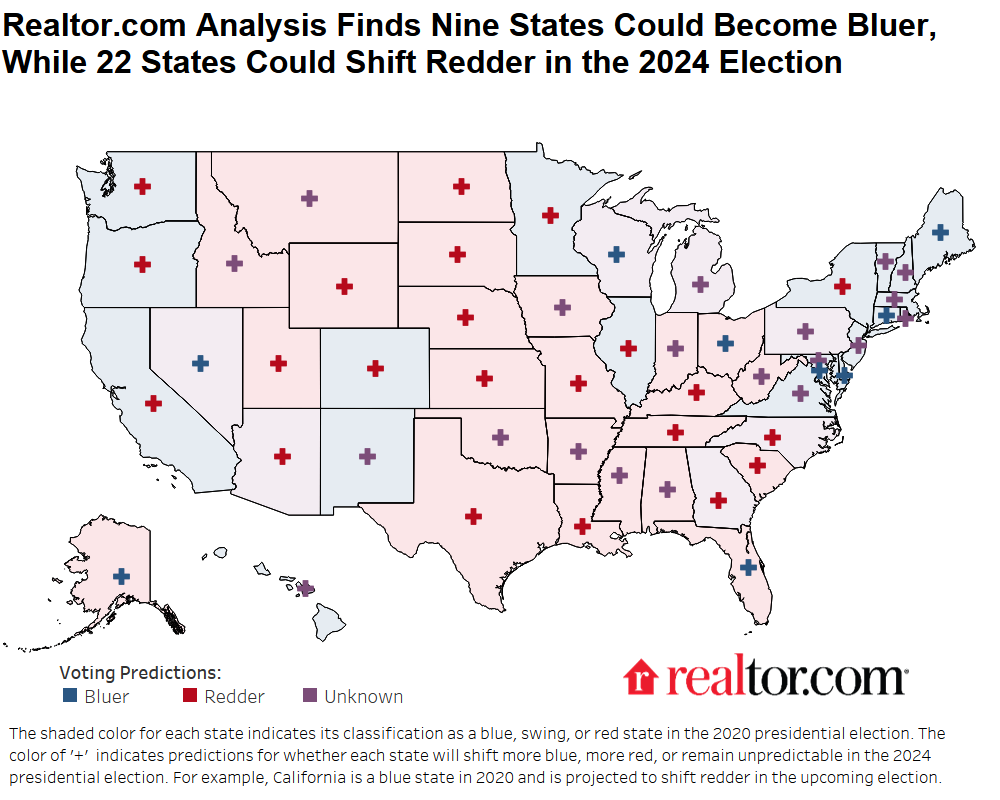
Realtor.com leveraged proprietary data on geographic home shopping trends to evaluate how population shifts could reshape the political landscape. Analysis of these data suggests the following possibilities for the 2024 Presidential election:
- Four blue states—Connecticut, Delaware, District of Columbia, Maine—could trend bluer
- Seven blue states—California, Colorado, Illinois, Minnesota, New York, Oregon and Washington—could trend redder
- Three red states—Alaska, Florida and Ohio— could shift bluer
- Twelve red states—Kansas, Kentucky, Louisiana, Missouri, Nebraska, North Dakota, South Carolina, South Dakota, Tennessee, Texas, Utah and Wyoming—could trend redder
- Two swing states—Wisconsin and Nevada— could shift bluer
- Three swing states—Arizona, Georgia and North Carolina—could trend redder
- Two swing states–Michigan and Pennsylvania–have mixed population shifts that do not suggest a clear direction–red or blue–for the local electorate
-
Because neither people nor opinions are fixed, the U.S. electoral map is constantly changing. This analysis highlights migration-informed possibilities that will factor alongside voter preferences on key issues to influence the Presidential election in 2024.
The influence of migration on election outcomes is a compelling topic of discussion, sparking interest in how shifting populations might reshape the political landscape. As more people move across state lines, their voting habits have the potential to sway election outcomes, especially in crucial swing states, where even small changes in the electorate can tip the scales. This dynamic raises important questions about how migration trends could influence the future of American politics.
To assess how recent migration trends might impact the 2024 presidential election, we use Realtor.com online home shopping traffic data combined with .1 In order to explore moving interests by political affiliation, we examine county-level results from the 2020 presidential election. We determine the likelihood of each online view being associated with blue, red, or independent shoppers based on the proportion of votes each party received in the 2020 presidential election. For example, if 60% of voters in a county were Democrats, then we assume the likelihood of an online view coming from a blue shopper is 0.6. In other words, 60% of online traffic from this county are from blue shoppers.2
Based on this assumption, between January 2021 and September 2024, 56.5% of online traffic on Realtor.com came from blue shoppers, 41.7% were red shoppers and the rest–1.8%–are from independent shoppers.
Using this data, our research examines whether recent migration patterns could cause certain states to become bluer or redder in the upcoming 2024 election. Generally, if a state receives 1) more out-of-state traffic from blue shoppers than red and 2) also has a higher retention rate of local blue shoppers than red, we expect that state could trend bluer in the 2024 election. Conversely, if a state 1) receives more out-of-state traffic from red shoppers than blue and 2) also has a higher retention rate of local red shoppers than blue, we anticipate it could shift redder in the 2024 election.��
Where do blue and red shoppers move to?
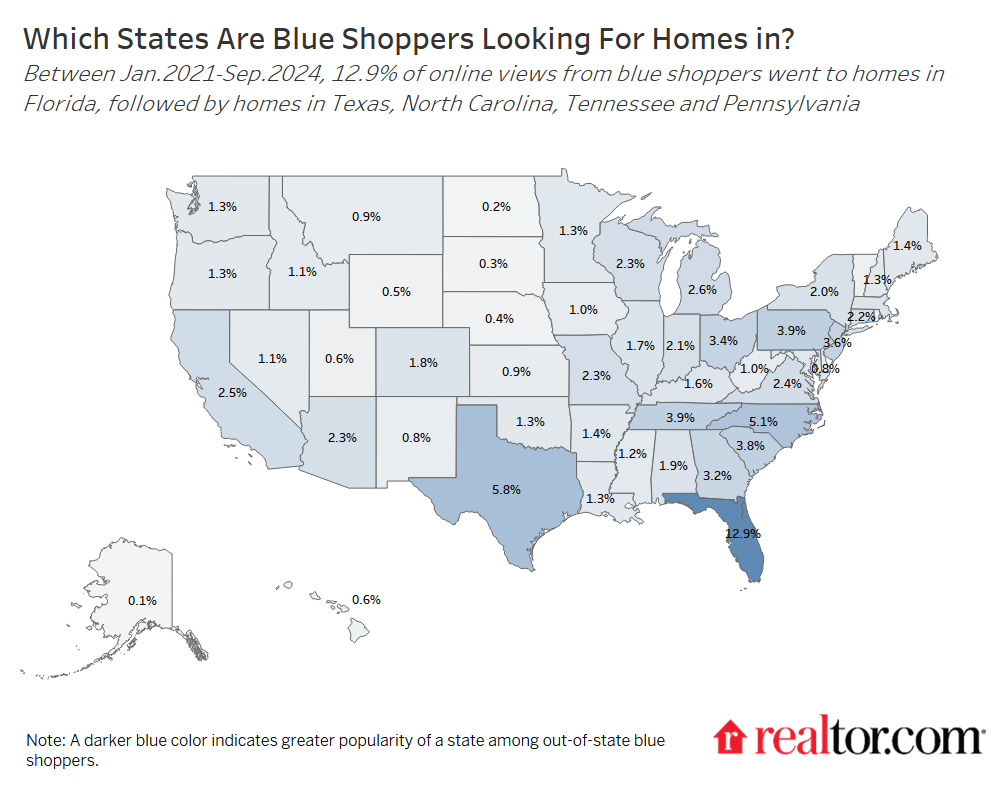
To identify the top out-of-state destinations for blue and red home shoppers, we estimated the share of traffic each state received from out-of-state blue or red buyers, relative to the total out-of-state traffic from blue or red shoppers. This helped us pinpoint states with the highest influx of blue and red shoppers.
For instance, between January 2021 and September 2024, 12.9% of out-of-state blue traffic across the U.S. targeted homes in Florida, 5.8% went to Texas, 5.1% to North Carolina, 3.9% to Tennessee, and 3.9% to Pennsylvania.
At the same time, Florida (12.8%), Texas (5.8%) and North Carolina (5.3%) also rank among the top destinations for red home buyers.��
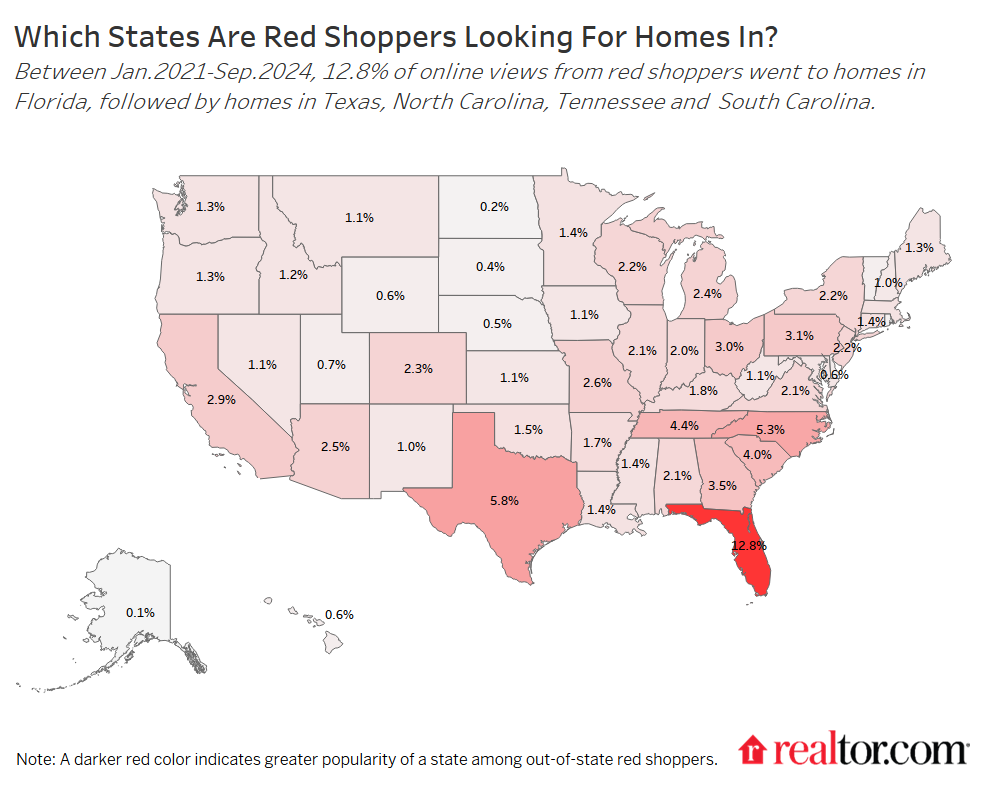
Interestingly, both blue and red out-of-state home shoppers showed great interest in homes in the South, probably driven by the relatively affordable housing markets and warmer climate.��
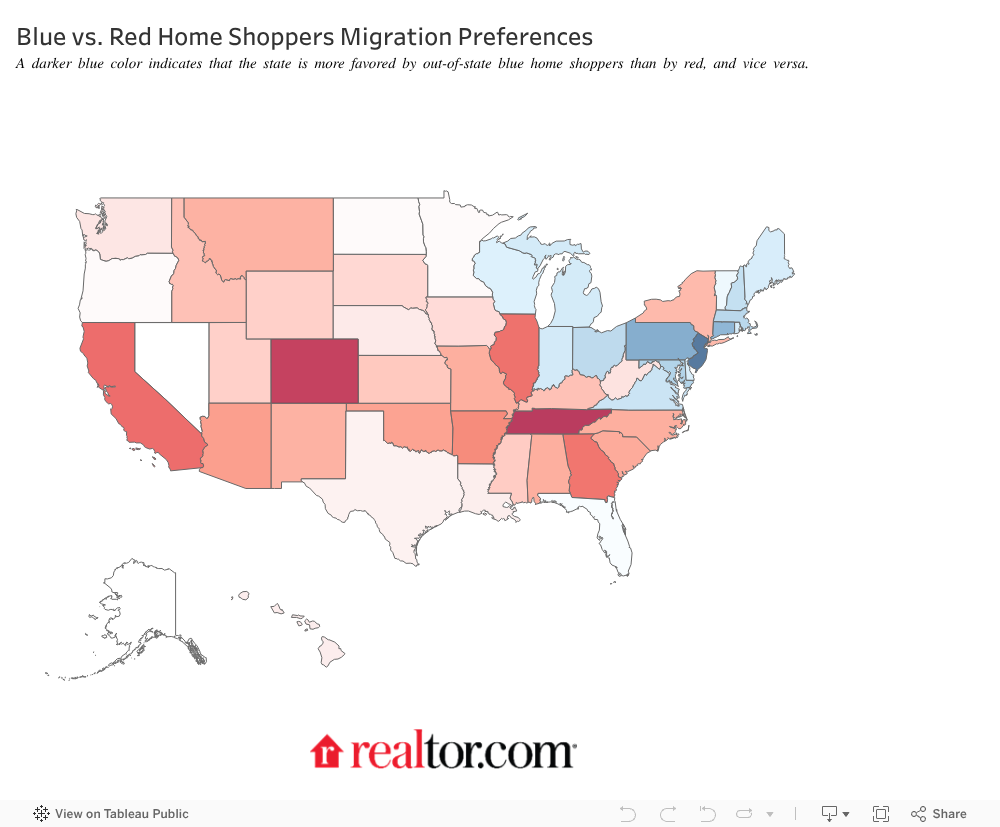
When a state receives a higher influx of blue shoppers compared to red shoppers, we consider it is a more appealing out-of-state destination for blue buyers, and vice versa.�� For instance, New Jersey, with a difference of 1.4 percentage points between blue and red influx rates, attracts more blue shoppers, while Tennessee is the most favored destination for out-of-state red buyers over their blue counterparts.
Where do blue and red shoppers remain?
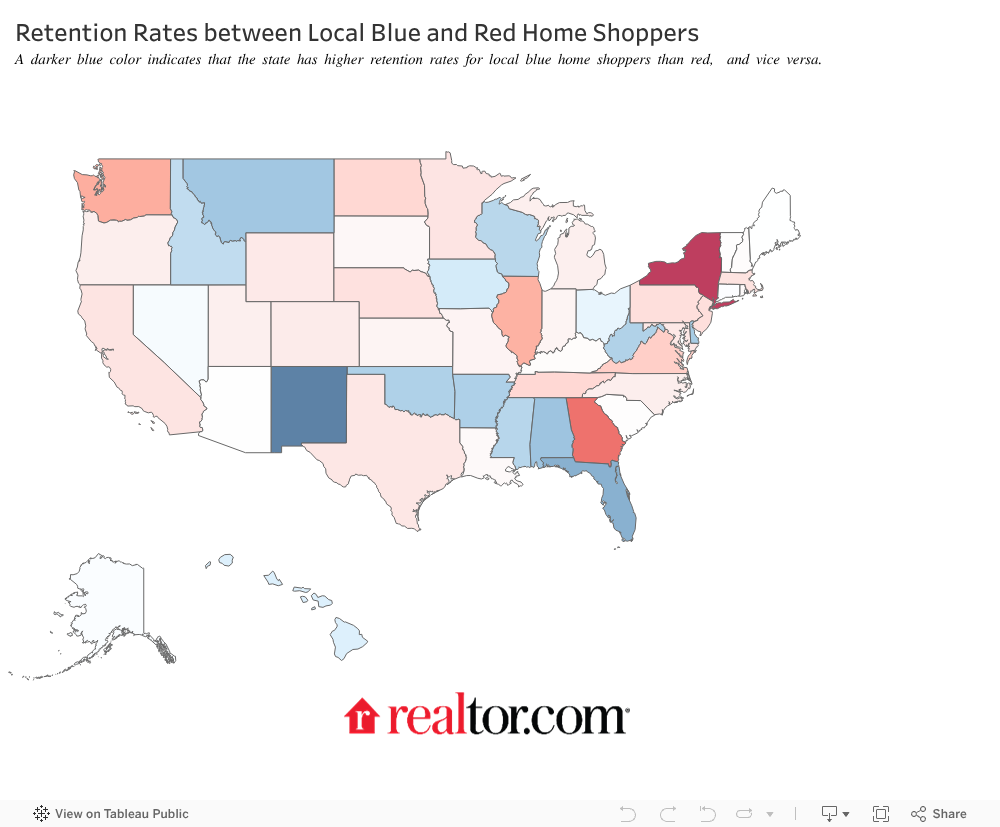
A desirable location for home buyers is not only defined by its ability to attract new migrants, but also by the willingness of current residents to stay. To evaluate this, we estimate the retention rate for in-state blue and red home buyers for each state. This is determined by calculating the proportion of in-state blue and red home buyers who choose to shop homes within their own state.
For example, between January 2021 and September 2024, Florida had the highest retention rate among blue shoppers, with 76.1% of blue traffic from Florida remaining in-state. Other states with high retention rates for blue home buyers include Michigan (74.2%), Ohio (73.6%), Texas (71.8%) and Wisconsin (71.5%).

Meanwhile, those five states also rank among the top states with the highest retention rates for red buyers: Michigan (75.6%), Florida (74.4%), Texas (73.9%), Ohio (73.4%) and Wisconsin (70.7%).��

When a state has a higher retention rate of blue shoppers compared to red shoppers, we consider it more appealing to in-state blue buyers, and vice versa. Specifically, New Mexico, with a 2.8 percentage point higher blue retention rate, retains more in-state blue shoppers. On the other hand, New York is the state where red home shoppers are more likely to continue to live in compared to blue peers.
Trend Bluer or Redder?
If a state 1) receives a higher traffic influx from blue shoppers than red and 2) has a higher retention rate of local blue home shoppers compared to red, we anticipate that state to trend bluer in the 2024 election. Conversely, if a state 1) draws more red influx traffic than blue and 2) and has a higher retention rate among local red home shoppers than the blue, we anticipate that state could become redder in the 2024 election.��
Our analysis indicates that nine states could turn bluer in the upcoming election: Alaska, Connecticut, Delaware, the District of Columbia, Florida, Maine,Nevada, Ohio and Wisconsin. Specifically, Connecticut, Delaware, and D.C. were won by Biden in the 2020 election by double-digit margins, and Maine was won by Biden by a margin of 9%. Wisconsin, a key tipping-point state in Biden’s victory, had a margin of less than 1% in that election, and Nevada was another state that was won by Biden less than 3%. Interestingly, Alaska, Florida and Ohio which were won by Trump last time by margins of 10%,3% and 8%, respectively, could shift bluer in the upcoming election based on this analysis.��
Meanwhile, 21 states could trend redder in the 2024 election. Of these, 12 states—Kansas, Kentucky, Louisiana, Missouri, Nebraska, North Dakota, South Carolina, South Dakota, Tennessee, Texas, Utah and Wyoming—were decisively won by Trump in 2020. Additionally, seven states—California, Colorado, Illinois, Minnesota, New York, Oregon and Washington—which Biden carried by a wide margin in 2020, are also projected to shift redder, but unlikely by enough to matter in 2024.�� Furthermore, three of the seven swing states–Arizona, Georgia and North Carolina–could lean further red in 2024. Notably, Arizona and Georgia, which Biden won by the smallest margins in 2020, could introduce added uncertainty to the upcoming election as they trended redder.��
However, the outlook for Pennsylvania and Michigan remain uncertain. Interestingly, Biden won both of these states in 2020. Despite higher influxes of blue shoppers in both of them, local blue residents are more likely to move away compared to their red counterparts, complicating efforts to predict the overall trend in these key battlegrounds.
In addition to shifting opinions on issues including increasing focus on home prices, and housing affordability for both homeowners and renters, the movement of people from state to state is likely to play a role in the 2024 presidential election. We’ll have to wait until the results in November to know whether housing-related vote-switching, migration, or other issues were most important to the electorate in 2024, but it’s likely each will play a role in the outcome.��
�ѱ�ٳ�ǻ�DZ��Dz���:��
To analyze the shifting interests and patterns of U.S. home shoppers, this research utilizes online home shopping traffic data from Realtor.com spanning January 2021 to September 2024. To further explore moving interests by political affiliation, we examine county-level results from the . We determine the likelihood of each online view being associated with a blue, red, or independent shopper based on the proportion of votes each party received in the 2020 presidential election.��
For instance, if 60% of voters in a county were Democrats, we would estimate that 60% of online traffic from that county comes from blue shoppers. This approach simplifies the analysis by assuming that the political affiliations of online home shoppers mirror the voter distribution in their respective counties. However, we do not consider other factors such as income, age, or housing preferences that may also influence online home shopping behavior.
Footnotes
- MIT Election Data and Science Lab, 2018, “County Presidential Election Returns 2000-2020”, , Harvard Dataverse, V13, UNF:6:GILlTHRWH0LbH2TItBsb2w== [fileUNF]
- In the absence of data on individual political preferences in real estate activity, this method simplifies the issue by assuming that the political affiliation of online home shoppers is proportional to the voter distribution in their county. We do not account for other factors like income, age, or housing preferences that could impact online home shopping behaviors.